if (!is.null(tanner$admb_reference$size_fit)) {
size_fit <- tanner$admb_reference$size_fit
size_keys <- c("modified_series", "year", "fleet", "season", "sex", "type", "shell", "maturity")
size_key_rows <- unique(size_fit[size_fit$vector == "obs", size_keys])
size_key_rows <- size_key_rows[order(size_key_rows$modified_series, size_key_rows$year), ]
series_ids <- sort(unique(size_key_rows$modified_series))[1:4]
old_par <- par(mar = c(3, 3, 2, 1), oma = c(0, 0, 0, 0))
layout(rbind(matrix(1:4, ncol = 2, byrow = TRUE), c(5, 5)), heights = c(1, 1, 0.16))
for (series in series_ids) {
candidates <- size_key_rows[size_key_rows$modified_series == series, ]
key <- candidates[nrow(candidates), ]
key_match <- rep(TRUE, nrow(size_fit))
for (key_name in size_keys) {
key_match <- key_match & size_fit[[key_name]] == key[[key_name]]
}
obs <- size_fit[key_match & size_fit$vector == "obs", c("size_bin", "value")]
pred <- size_fit[key_match & size_fit$vector == "pred", c("size_bin", "value")]
x <- merge(obs, pred, by = "size_bin", suffixes = c("_observed", "_predicted"))
x <- x[order(x$size_bin), ]
observed <- x$value_observed / sum(x$value_observed)
predicted <- x$value_predicted / sum(x$value_predicted)
ylim <- range(c(observed, predicted), finite = TRUE)
mids <- barplot(observed, col = "#1b6da8", border = NA,
ylim = ylim, xlab = "", ylab = "",
main = paste("Series", series, key$year), bty = "l")
axis(1, at = mids, labels = x$size_bin)
lines(mids, predicted, lwd = 2, col = "#c43c39")
grid(col = "grey88")
}
if (length(series_ids) < 4) {
for (unused in seq_len(4 - length(series_ids))) {
plot.new()
}
}
par(mar = c(0, 0, 0, 0))
plot.new()
legend("center", horiz = TRUE, bty = "n",
fill = c("#1b6da8", NA), border = c(NA, NA),
lty = c(NA, 1), lwd = c(NA, 2), col = c(NA, "#c43c39"),
legend = c("Observed", "Predicted"))
layout(1)
par(old_par)
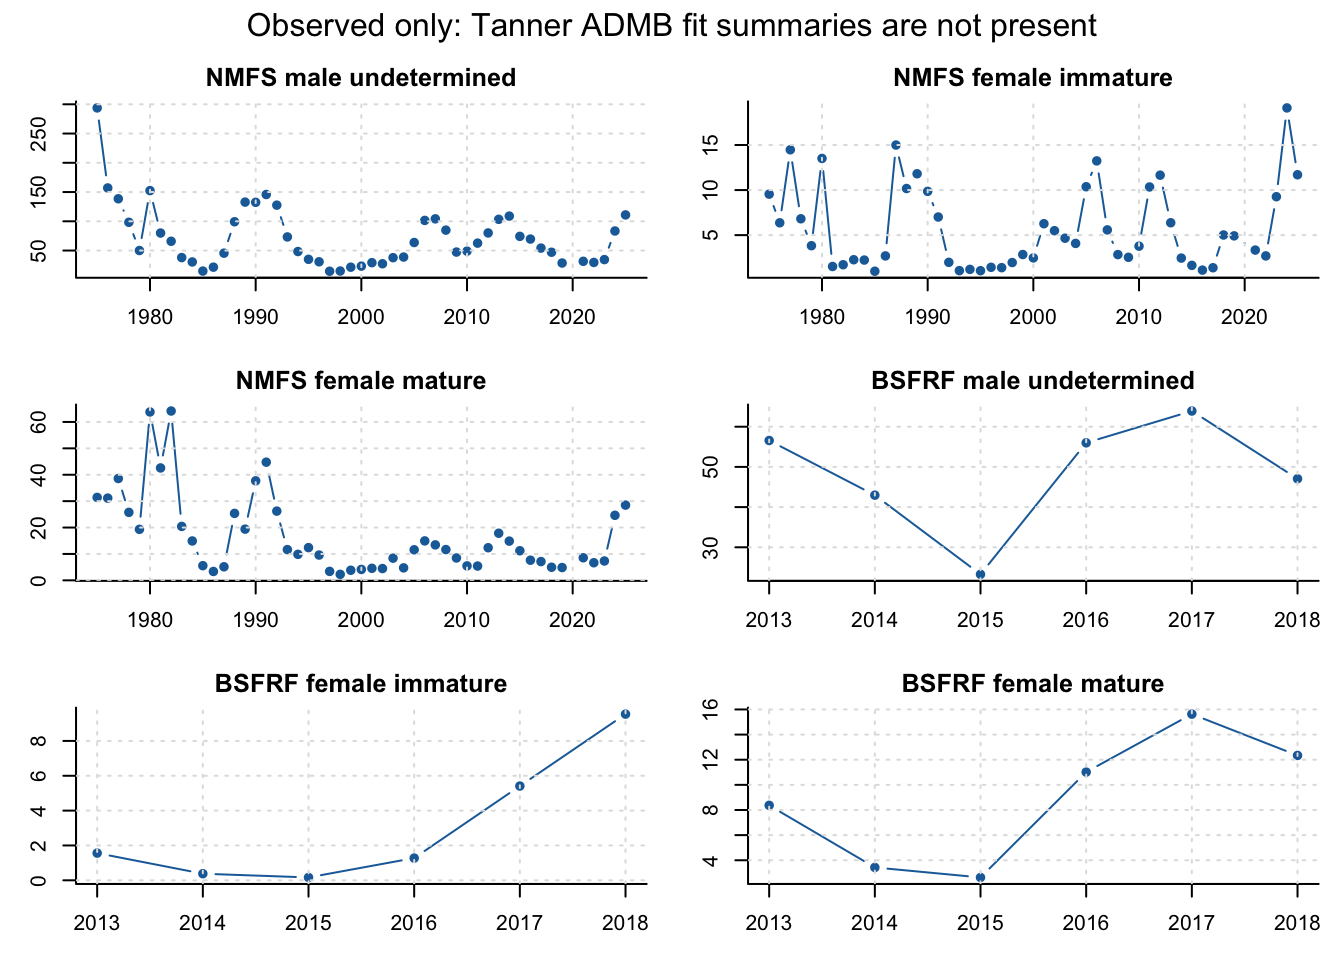
} else {
size_obs <- tanner$data$size_comp_observations
series_ids <- sort(unique(size_obs$series))[1:4]
old_par <- par(mfrow = c(2, 2), mar = c(3, 3, 2, 1), oma = c(0, 0, 2, 0))
for (series in series_ids) {
x <- size_obs[size_obs$series == series, ]
x <- x[order(x$year), ]
row <- x[nrow(x), ]
bins <- grep("^bin_", names(row), value = TRUE)
values <- as.numeric(row[1, bins])
values <- values / sum(values)
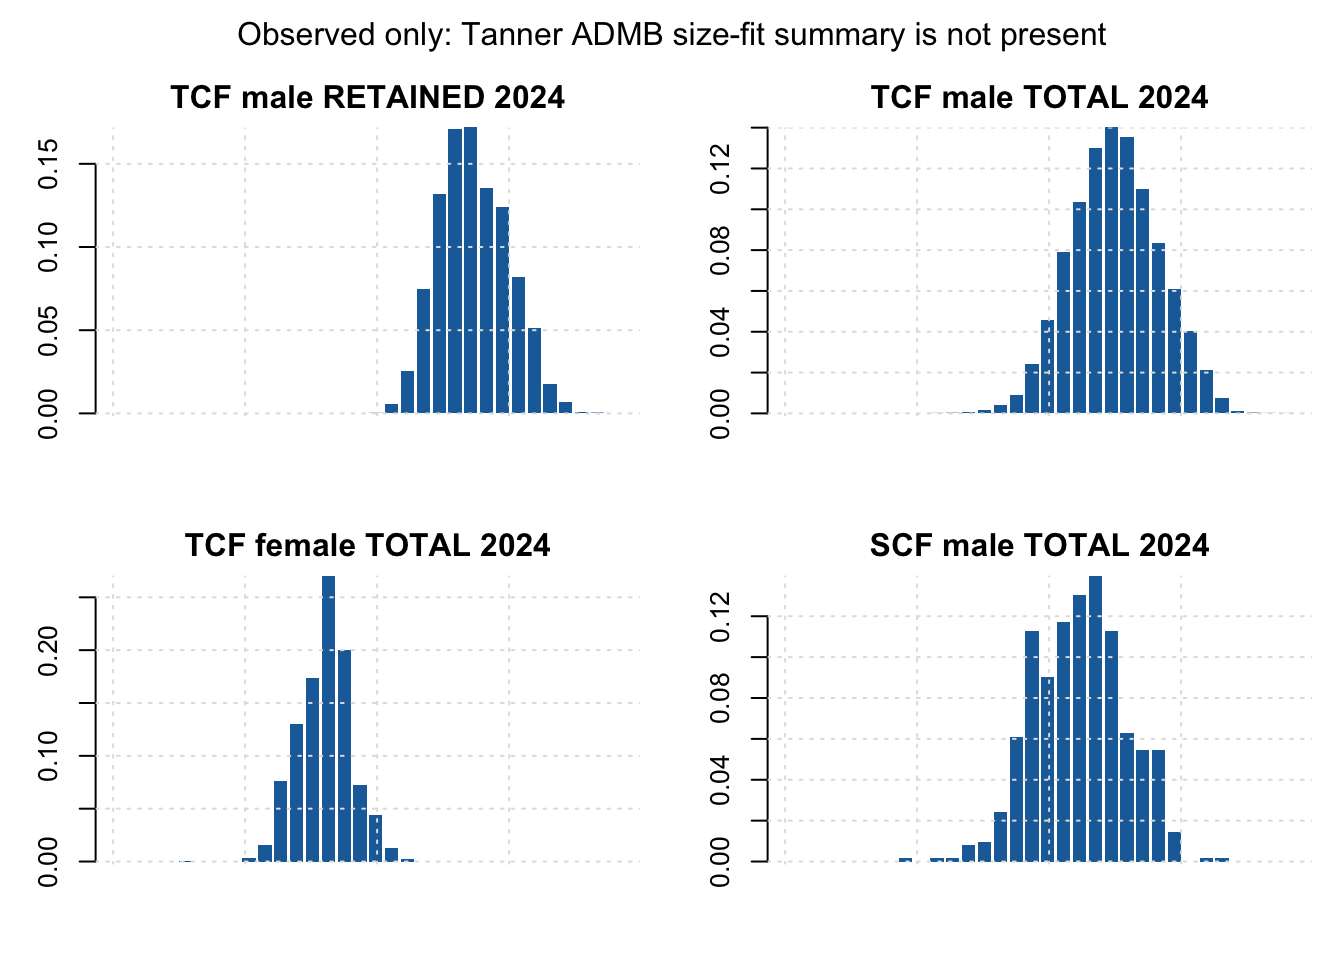
barplot(values, col = "#1b6da8", border = NA,
xlab = "", ylab = "", main = paste(row$fleet, row$sex, row$catch_type, row$year),
bty = "l")
grid(col = "grey88")
}
mtext("Observed only: Tanner ADMB size-fit summary is not present", outer = TRUE, line = 0.4)
par(old_par)
}