Northern Fur Seal Movement, Dive Behavior, and Oceanography in the Bering Sea and Pacific Ocean

Warning
The information on this page is automatically updated every hour and without any significant quality checks. Errors may be present and are likely. We are providing access to the information in a public forum in the spirit of open science and to provide easy access to updated information for the authors and interested researchers.
The information provided here should not be cited or referenced in any form
Disclaimer
The scientific results and conclusions, as well as any views or opinions expressed herein, are those of the author(s) and do not necessarily reflect the views of NMFS, NOAA, or the Department of Commerce.
Predicted Movements
 In September 2022 bio-loggers (SPLASH-F, Wildlife Computers1, Redmond, Washington) were deployed on adult female northern fur seals at San Miguel Island, California (n=6) and St. Paul Island, Alaska (n=6). Then in 2023, additional bio-loggers (n=11) were deployed on adult female northern fur seals at Bogoslof Island, Alaska. The three maps below provide near real-time predicted movement paths based on a continuous time correlated random walk model (via the R package,
 aniMotum). This movement model uses both Argos and Fastloc GPS derived locations to produce a predicted path that most-likely represents the actual movement of the fur seal. Here, the path shown is based on 15 minute predictions. New data are downloaded, processed, and modeled at least hourly every day.
The maps below are interactive and can be zoomed in/out using the scroll wheel on the mouse. The background tiles provide general representation of bathymetric features but are kept relatively simple so the maps remain responsive and interactive. Additionally, the solid dots indicate the last known location. Hovering over a dot will show the deployid and date time associated with that location.
Dive Behavior
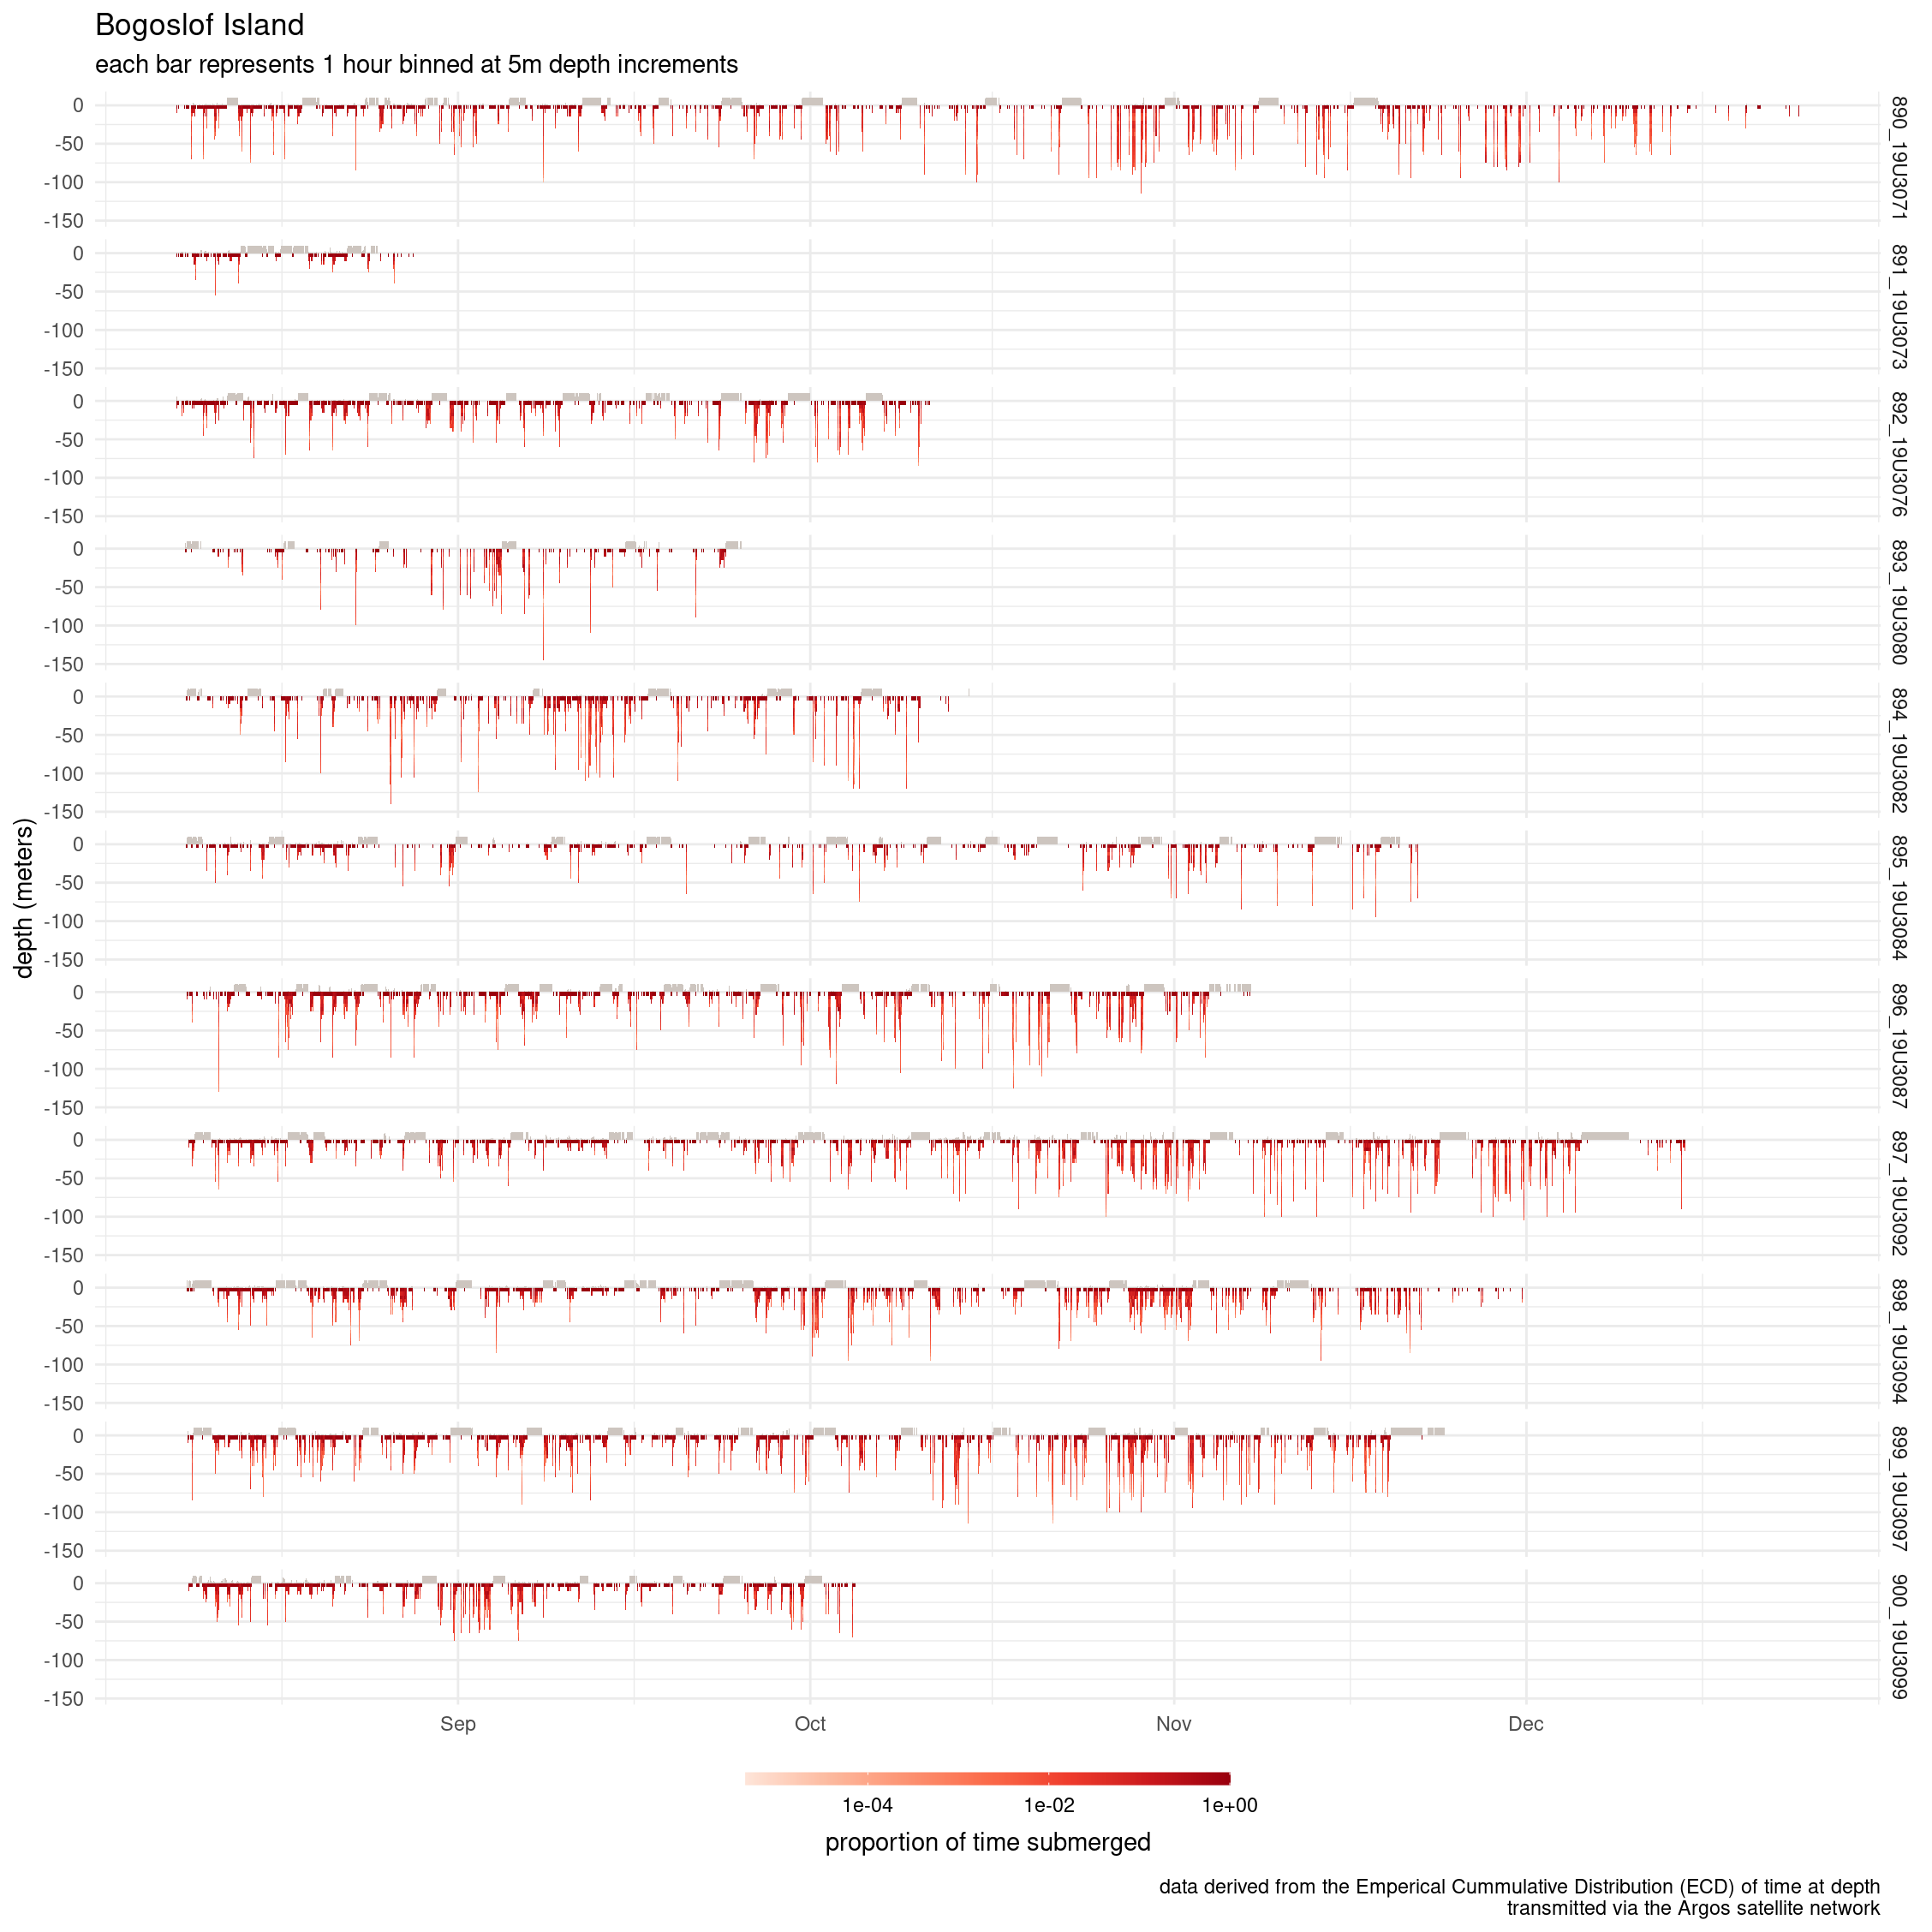
The SPLASH-F bio-loggers were programmed with a new option for summarizing dive behavior. The Argos satellite network has limited bandwidth available for transmitting data. This, combined with the inherent nature of a marine mammal to spend considerable time at sea and under water, restricts the amount of information that can be transmitted. The Empirical Cumulative Distribution (ECD) of time at depth provides an efficient and flexible data message for summarizing the proportion of time spent at varying depths during specified time periods. Unlike previous dive summary messages (e.g. histograms), the depth bins are not specified in advance. The ECD adjusts to always include the full range of depths explored during the summary period.
In this study, the ECD summary period was specified at 1 hour. This is the finest resolution summary period and aligns well with our movement model prediction interval. However, such resolution comes at a cost. The transmission buffer on the SPLASH-F is limited to 100 messages and only 2 summary periods are encoded in a single message (in this study: 2 hours per message). In addition to ECD messages, the SPLASH-F is also collecting Fastloc GPS data and oceanographic depth and temperature profiles. Since approximately 25 messages are generated per day that means the buffer holds about 4 days worth of messages. Fur seals, spend relatively little time at the surface when at sea and, thus, not all messages are successfully transmitted. This is apparent in the plots below where there are open gaps in the timeline representing hours for which no data is available.
A key objective of this study is to push the limits of transmission so we can learn from real-world deployments in challenging environments. With this information we can work with Wildlife Computers to improve the capabilities and make better informed programming decisions in the future.


Oceanographic Temperature Profiles
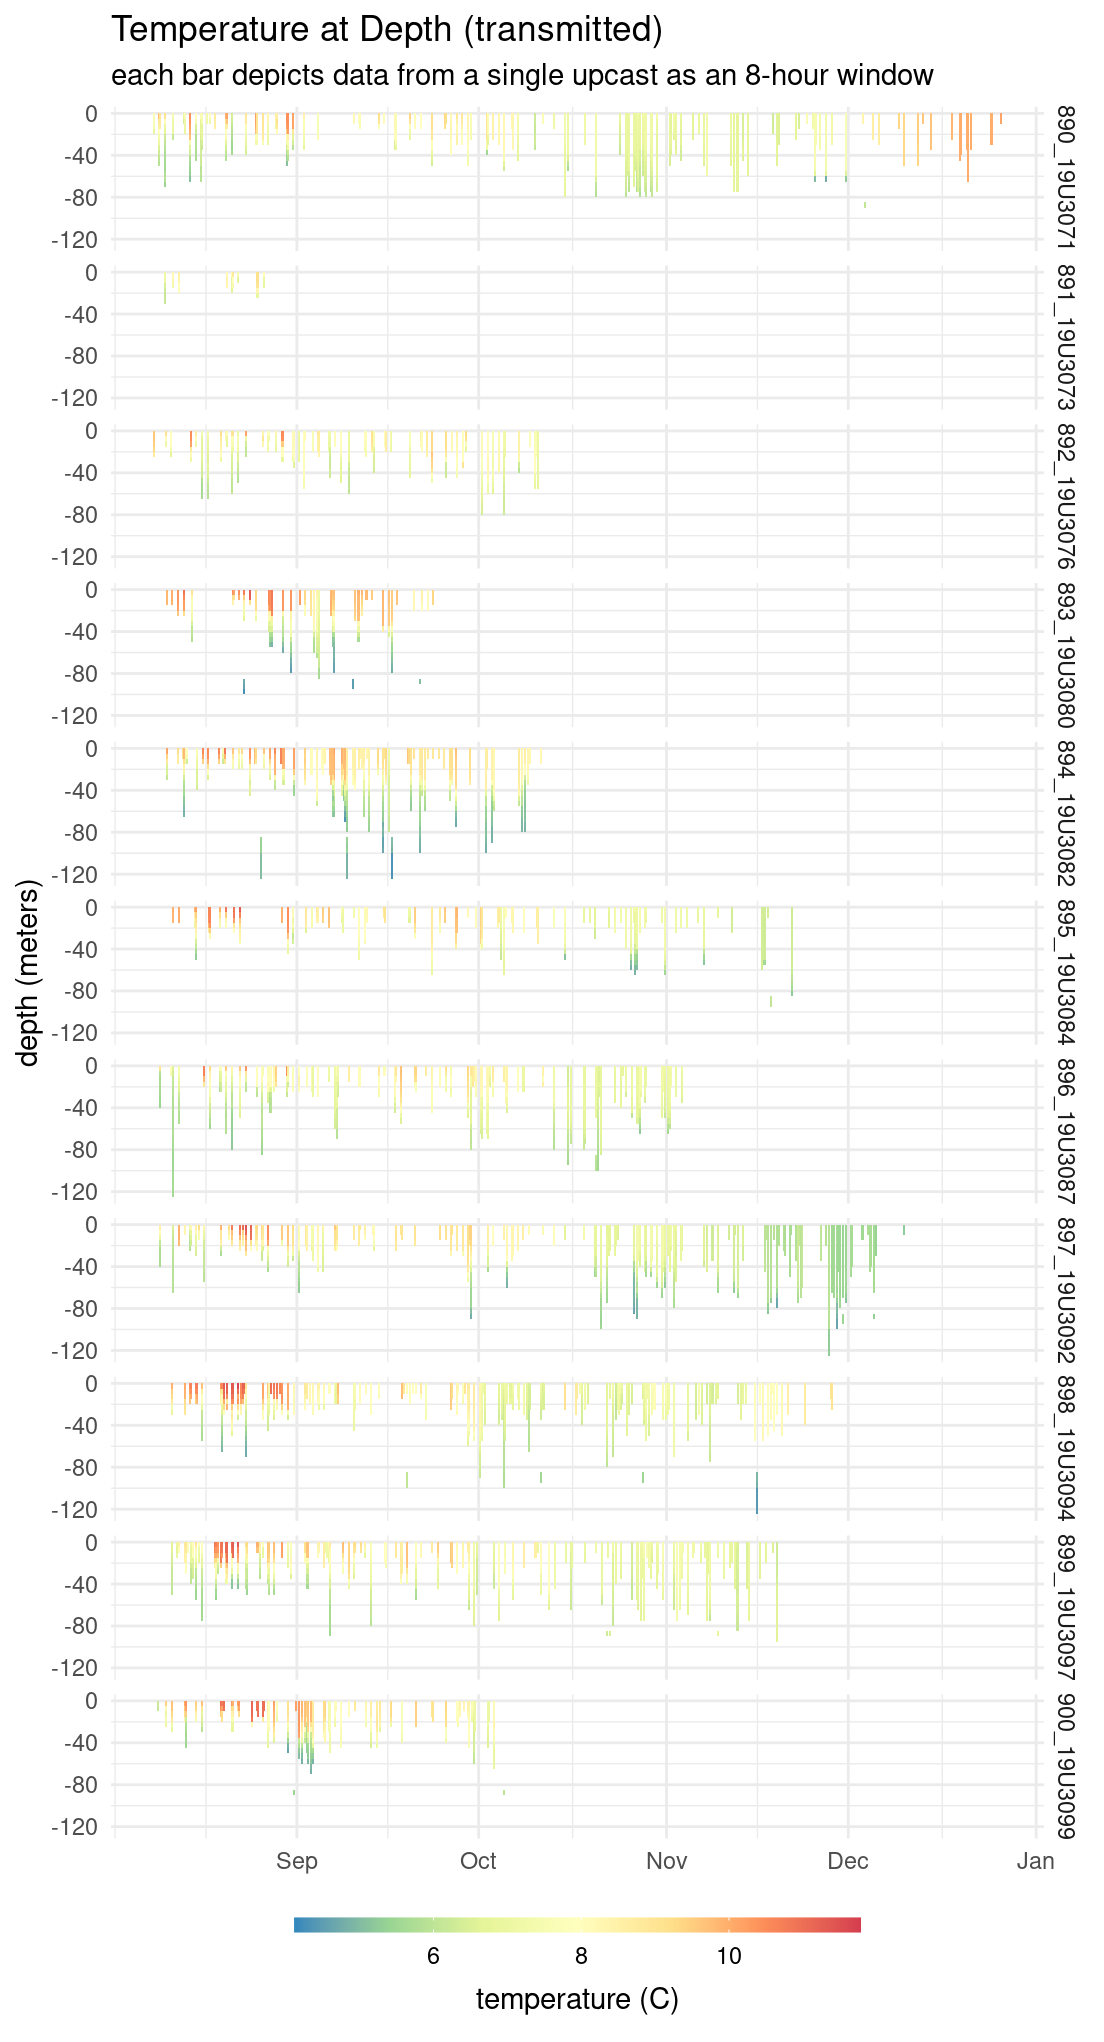
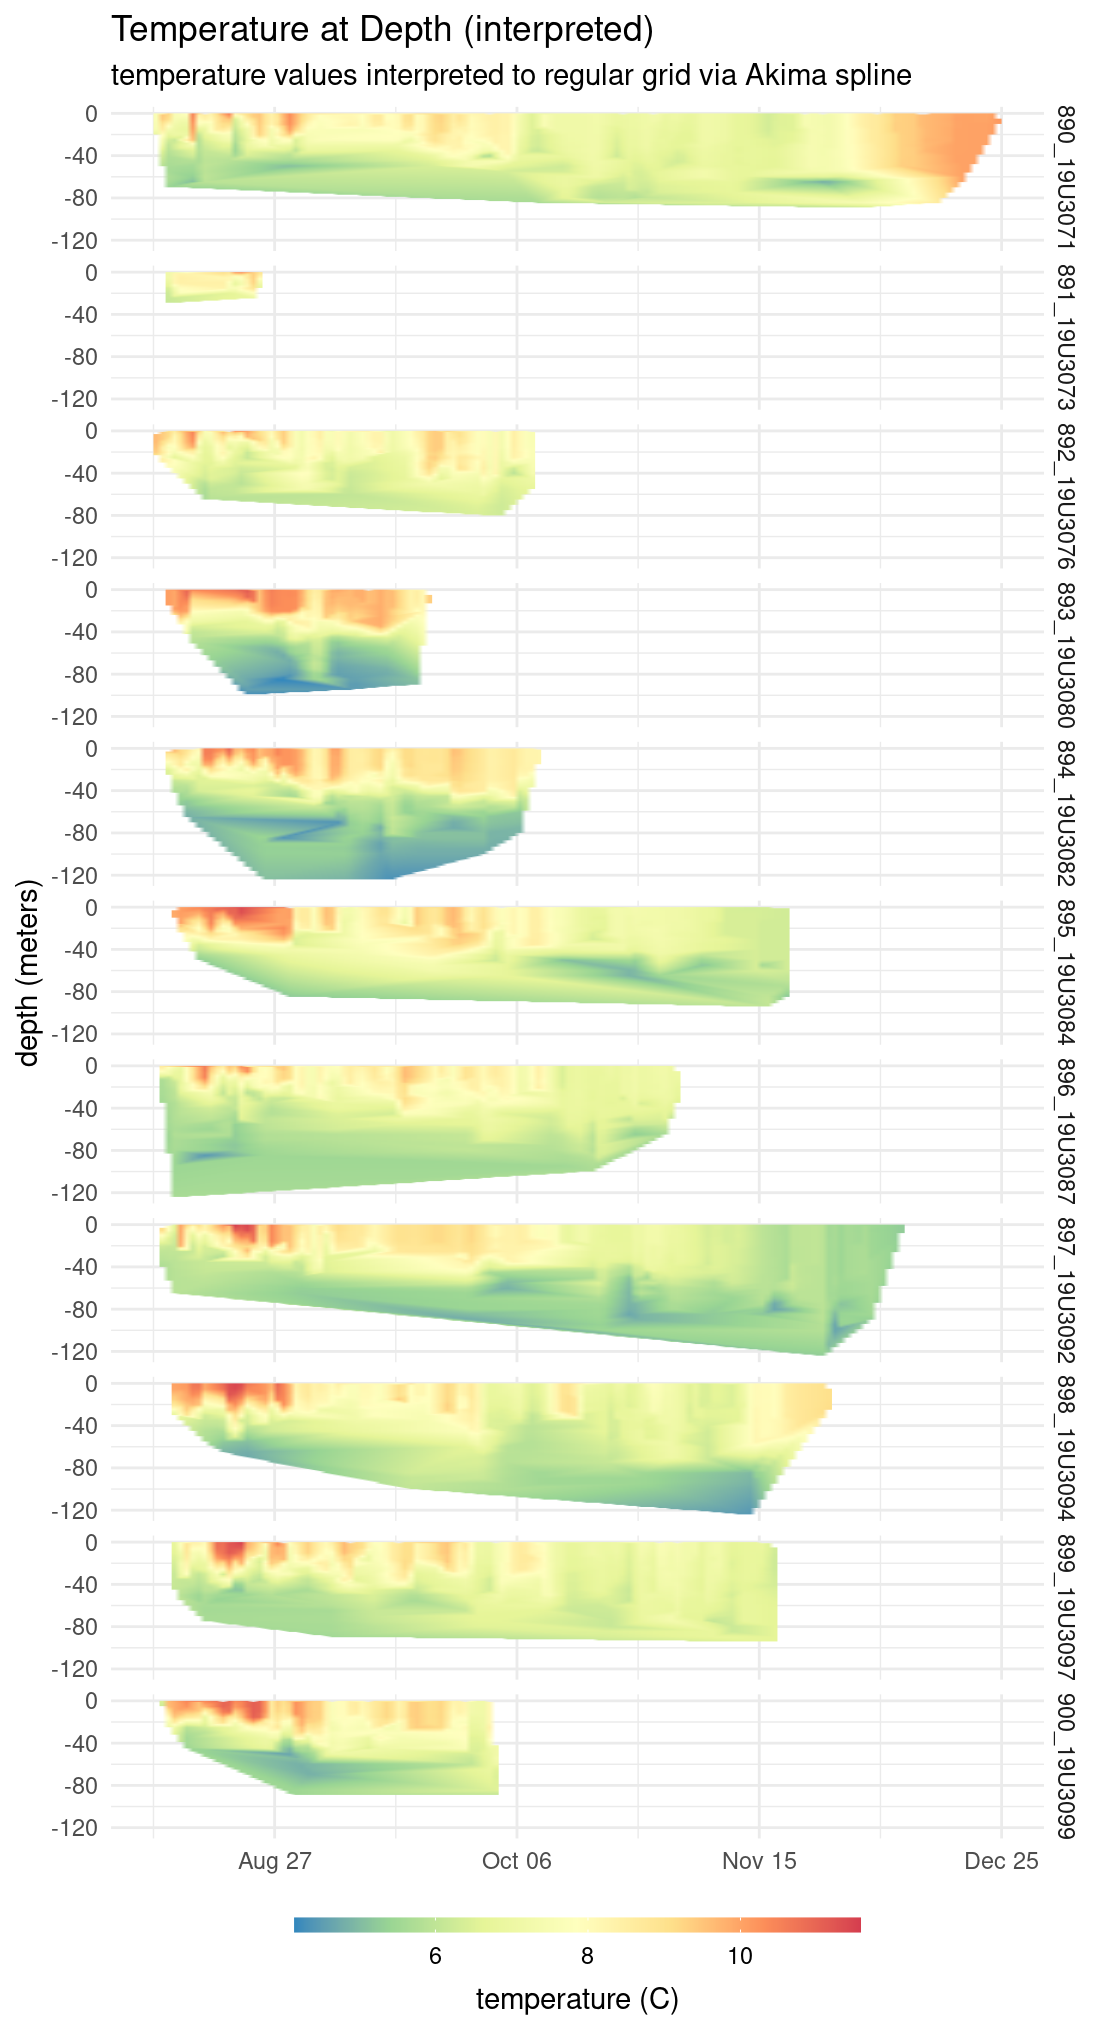
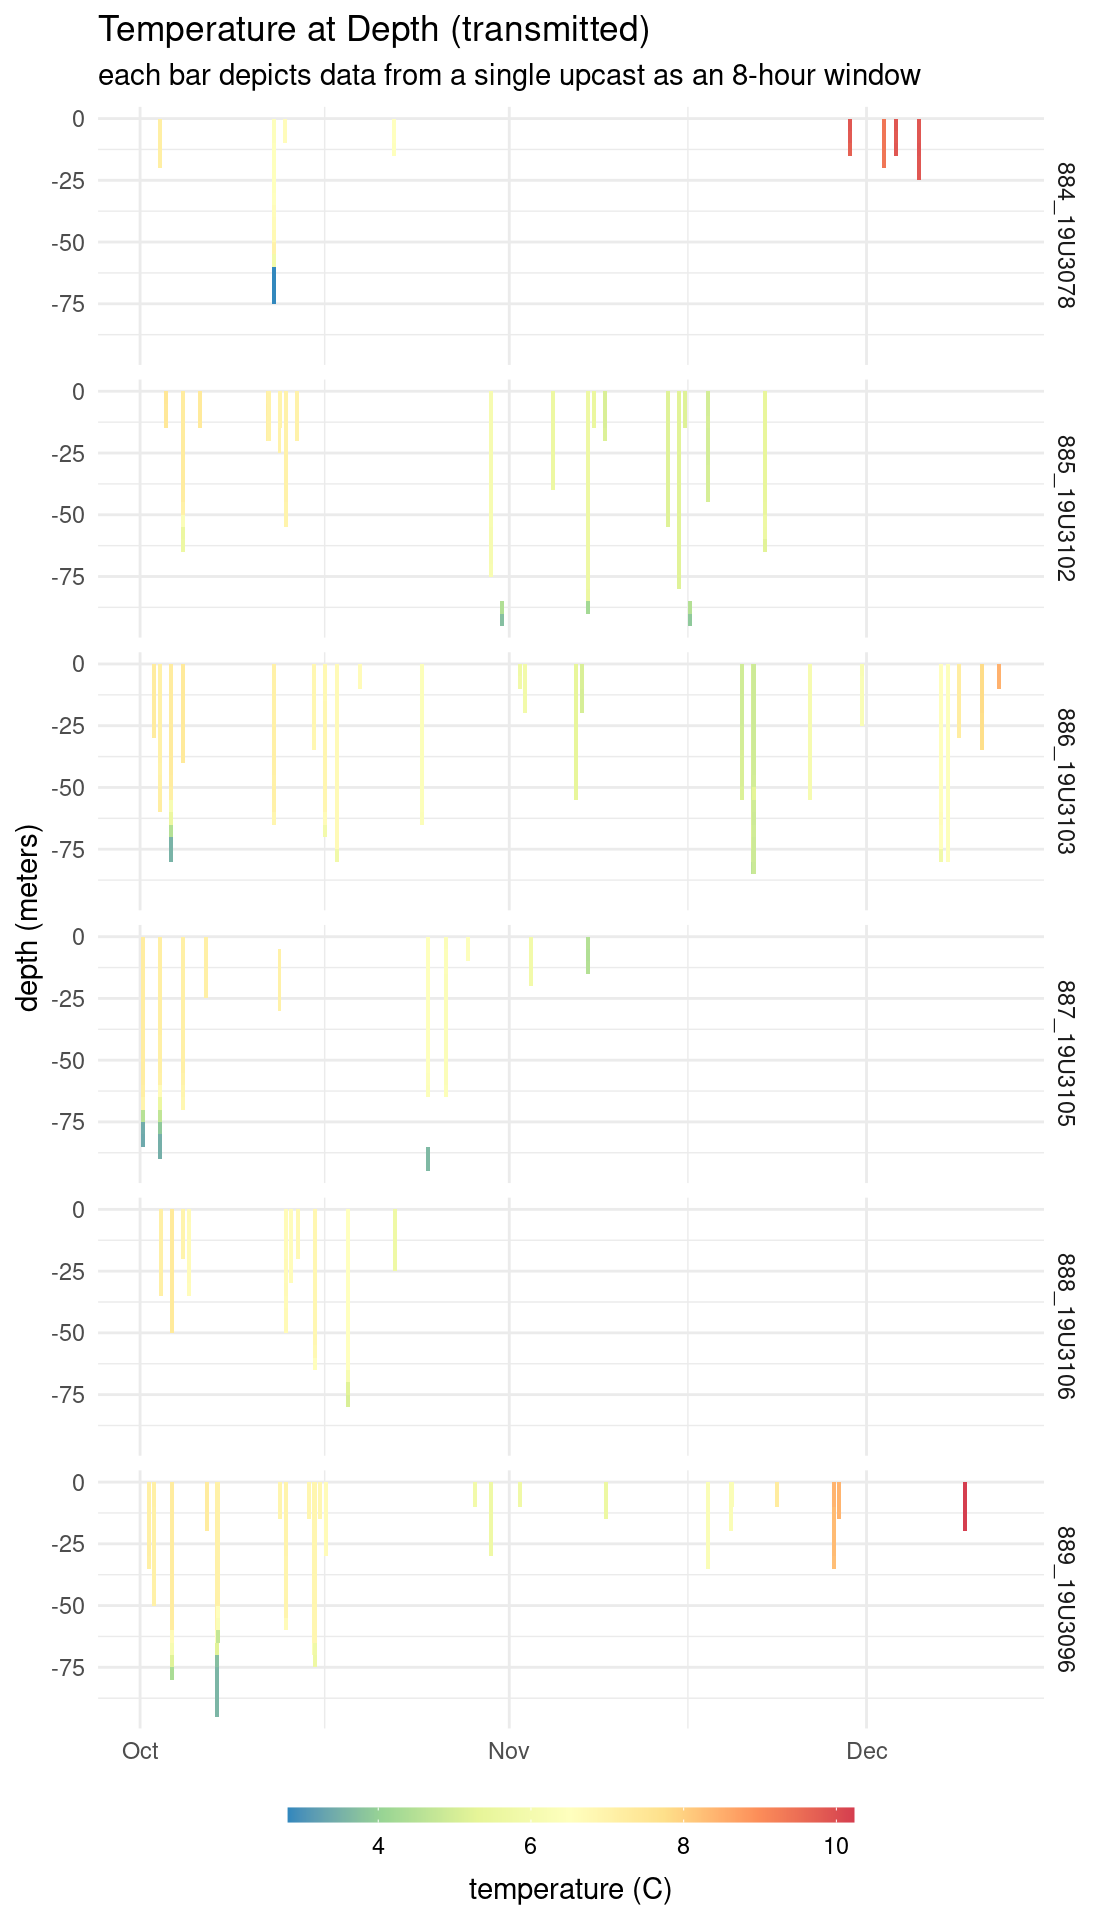
The deployed bio-loggers also have the capability of recording temperature at depth profiles. Temperature and depth values are collected on dive ascents at 1 Hz and are only created on qualifying dives, and when enabled in the transmission schedule (in this study, just 2 hours per day, 11 hours apart). If a dive descends 10% deeper than any previous dive in the current summary period, then all previous data are cleared, and new temperature-depth data are collected for the remainder of the current dive.
The temperature is saved at the depths specified in the World Ocean Database 2013 (WOD13). Additionally, the entire range of depths cannot be encoded into a single Argos message. So, depth ranges from 0-80 meters, 85-425 meters, and 450-1200 meters are encoded in separate messages. Therefore, it’s possible to only receive portions of the complete dive profile.
In the figures below, you’ll notice large gaps in time between dive profiles. This is largely due to the limited window during which the tags were programmed to collect profiles – just 2 separate hours per day with 11 hours between them.
Bogoslof Island


Project Summary
In 2018, the AFSC Polar Ecosystems Program and Wildlife Computers began collaboration on a project to develop a new family of SPLASH bio-loggers that would provide a small footprint device capable of FastLoc GPS, ocean temperature profiles, and on-board dive behavior summaries that provide unbiased data and efficient transmission via Argos. Due to the COVID-19 pandemic, the intended deployments on ribbon and spotted seals in 2020 were not possible, and in the spring of 2022, only 2 of the 25 devices available were deployed. Instead of letting these devices sit on the shelf for 2+ years, we have developed a plan to deploy a portion of them on northern fur seals at San Miguel Island and northern fur seals at St. Paul Island and Bogoslof Island in Alaska. These tags were originally funded by the US Navy in 2017.
These tags employ two key enhancements that have not been previously available:
- Improved ocean temperature profile capabilities with a dedicated external thermistor probe
- On-board processing of time-at-depth data to create a more efficient dive behavior summary message that relies on empirical cumulative distributions instead of the typical histogram bin approach used for decades.
Because relatively few devices with these new capabilities have been deployed (by MML or other researchers), there is a great need to observe how these new devices perform, to evaluate how efficient the data transmissions are, and to learn from real-world experience so future deployments can be optimized for a range of study questions.
Footnotes
Any reference to specific commercial products, processes, or services by service mark, trademark, manufacturer, or otherwise, does not constitute or imply their endorsement, recommendation or favoring by the Department of Commerce.↩︎