Attaching package: 'dplyr'The following objects are masked from 'package:stats':
filter, lagThe following objects are masked from 'package:base':
intersect, setdiff, setequal, unionAssessment homepage · Current assessment
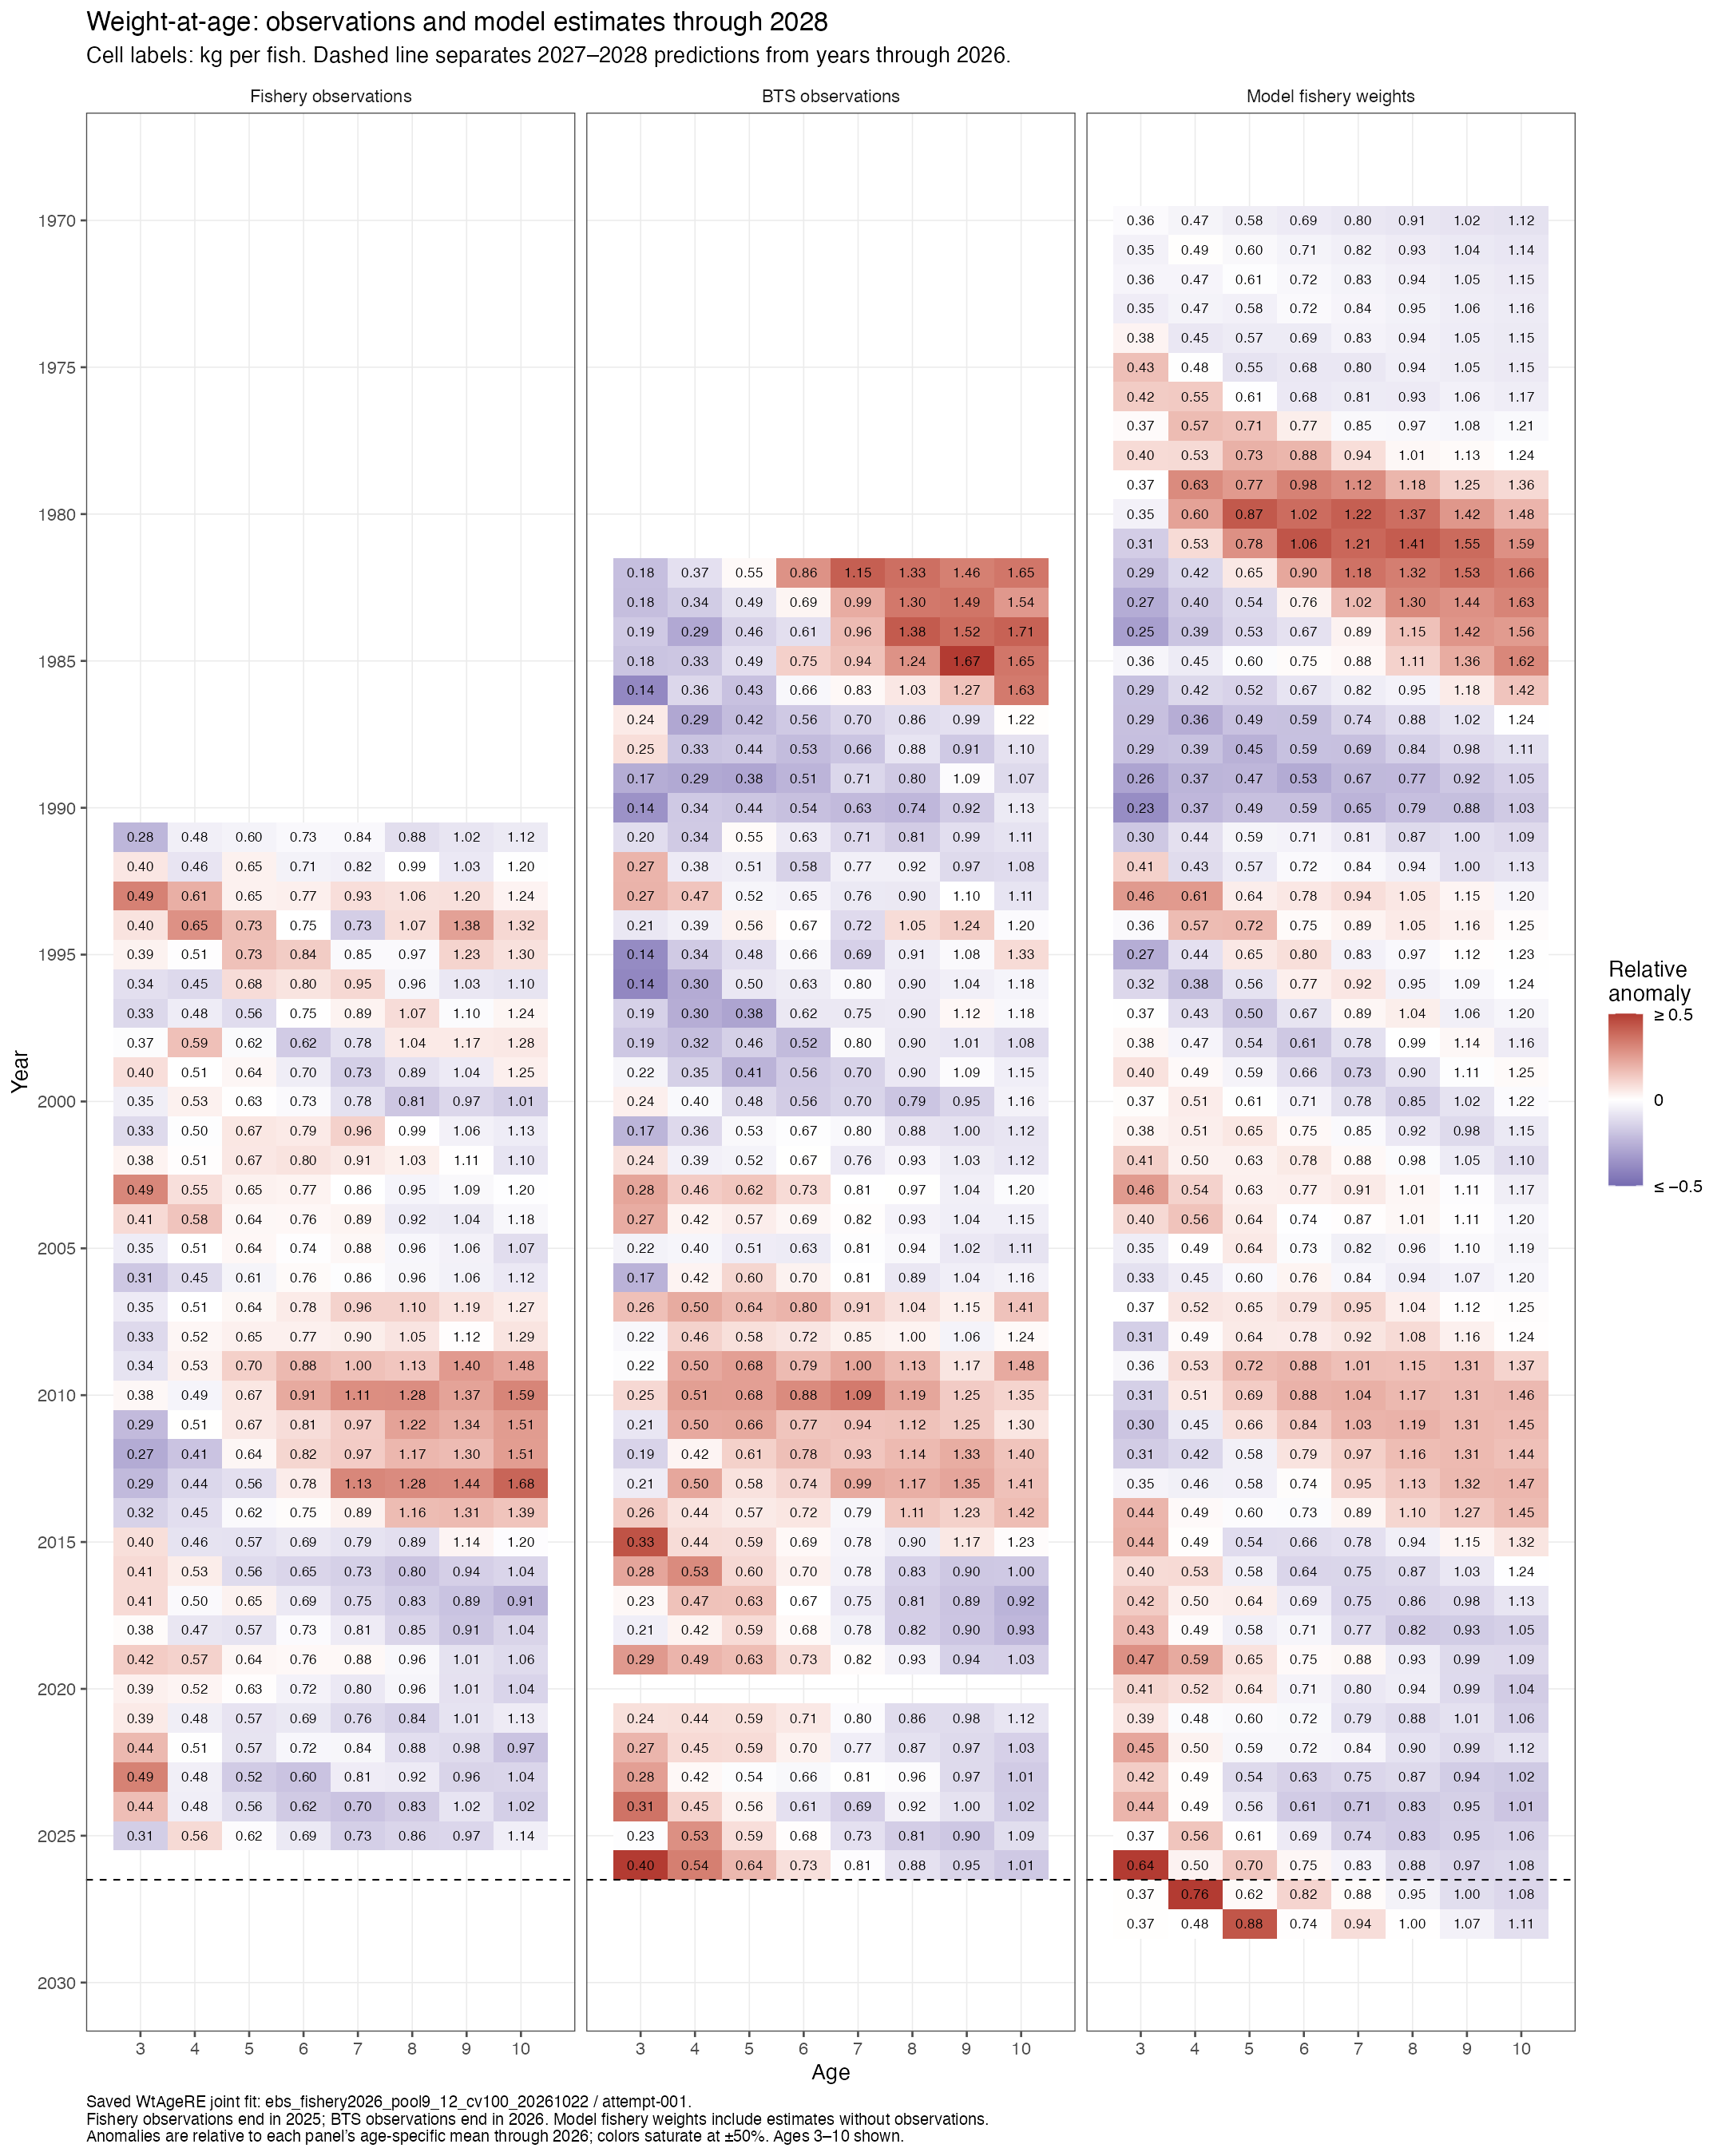
This separate sensitivity doubles the observation SDs for BTS weight-at-age in 2025 and 2026. Observed means are identical, so CVs double and variances increase fourfold. All other input values, the saved RTMB model and adapter, default starts, and fitting procedure are preserved. The original fit and assessment outputs remain the baseline; this sensitivity has no assessment-model refit.
Attaching package: 'dplyr'The following objects are masked from 'package:stats':
filter, lagThe following objects are masked from 'package:base':
intersect, setdiff, setequal, unionThe fit converged with a maximum gradient of 8.72e-08 and a positive-definite fixed-parameter Hessian (minimum eigenvalue 86.467). The conditional random-effect Hessian and joint uncertainty precision are also positive definite. Model graph construction and fitting captured zero warnings; the fitting process exited 0. An independent graph rebuild reproduced the objective and verified gradients and curvature.
The input file contains 30 changed SD cells (all ages 1–15 for both recent BTS years). Of these, 26 observations at ages 3–15 enter this fit. Means, observation masks, fishery inputs, and BTS errors in every other year were independently checked against the original run. The converted TMA age basis and fixed conversion-key treatment are preserved.
The 2026 modeled BTS age-3 weight decreases from 0.384 to 0.342 kg (−10.9%), and the predicted fishery age-3 weight decreases from 0.643 to 0.580 kg (−9.8%). The observed values remain unchanged. Both series respond because the standalone model fits fishery and BTS data jointly; the fishery 2026 value is a prediction rather than an observation.
| Series | Year | Original (kg) | Doubled BTS CV (kg) | Change (%) |
|---|---|---|---|---|
| fishery | 2024 | 0.438 | 0.438 | −0.1 |
| fishery | 2025 | 0.367 | 0.334 | −8.9 |
| fishery | 2026 | 0.643 | 0.580 | −9.8 |
| fishery | 2027 | 0.370 | 0.369 | −0.3 |
| fishery | 2028 | 0.370 | 0.369 | −0.3 |
| BTS | 2024 | 0.261 | 0.258 | −1.3 |
| BTS | 2025 | 0.219 | 0.197 | −10.0 |
| BTS | 2026 | 0.384 | 0.342 | −10.9 |
| BTS | 2027 | 0.220 | 0.217 | −1.5 |
| BTS | 2028 | 0.220 | 0.217 | −1.5 |
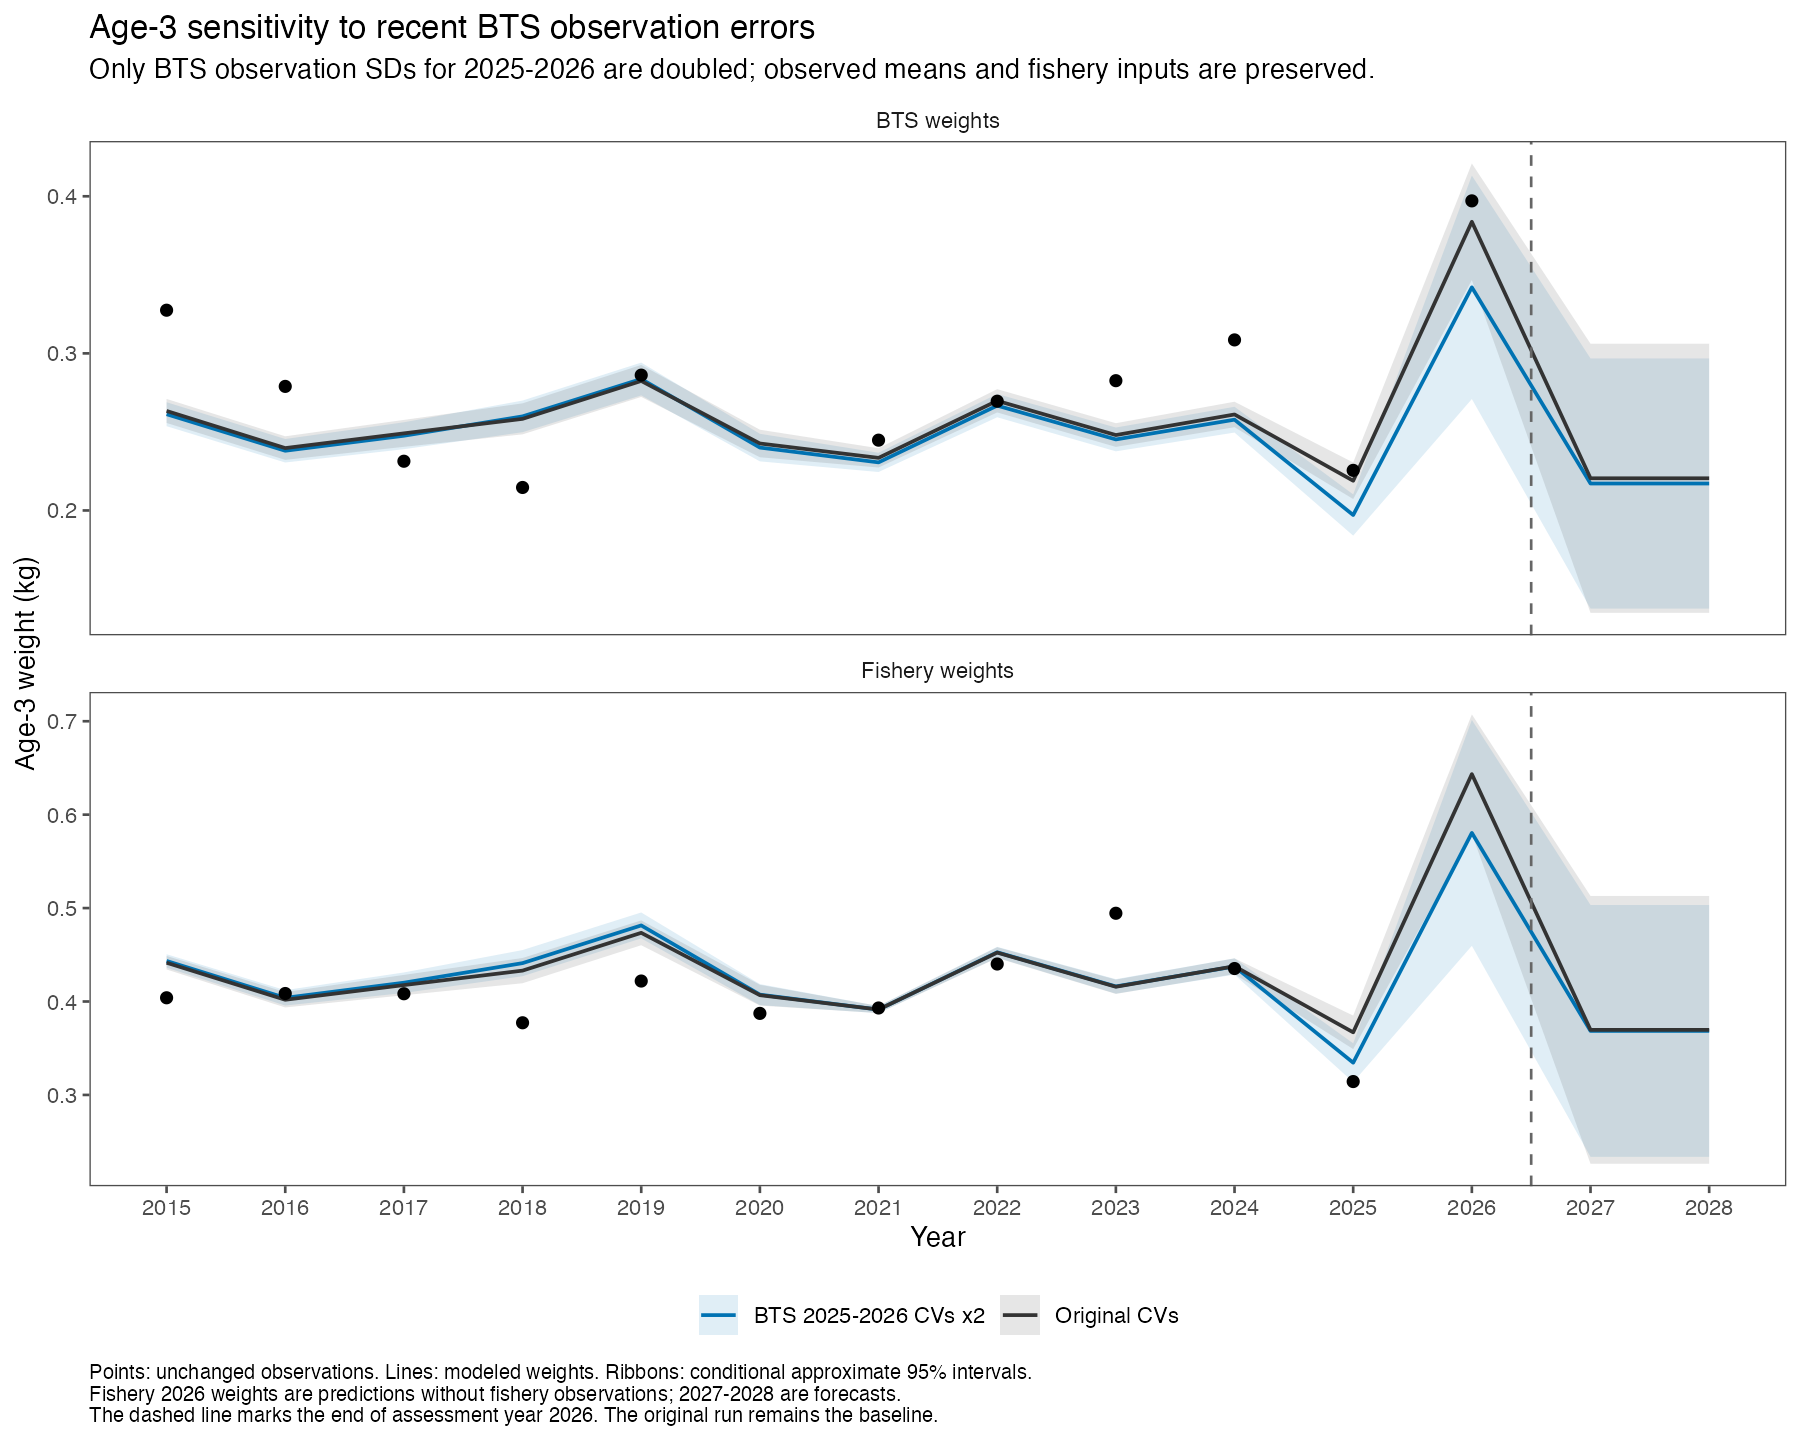
The Fishery and BTS observation panels are unchanged. The third panel shows the new modeled fishery weights through 2028. Colors use the original plot’s panel- and age-specific reference means through 2026, so the anomaly reference and color limits are held fixed between the two figures. Cell labels are kg per fish, not anomalies.
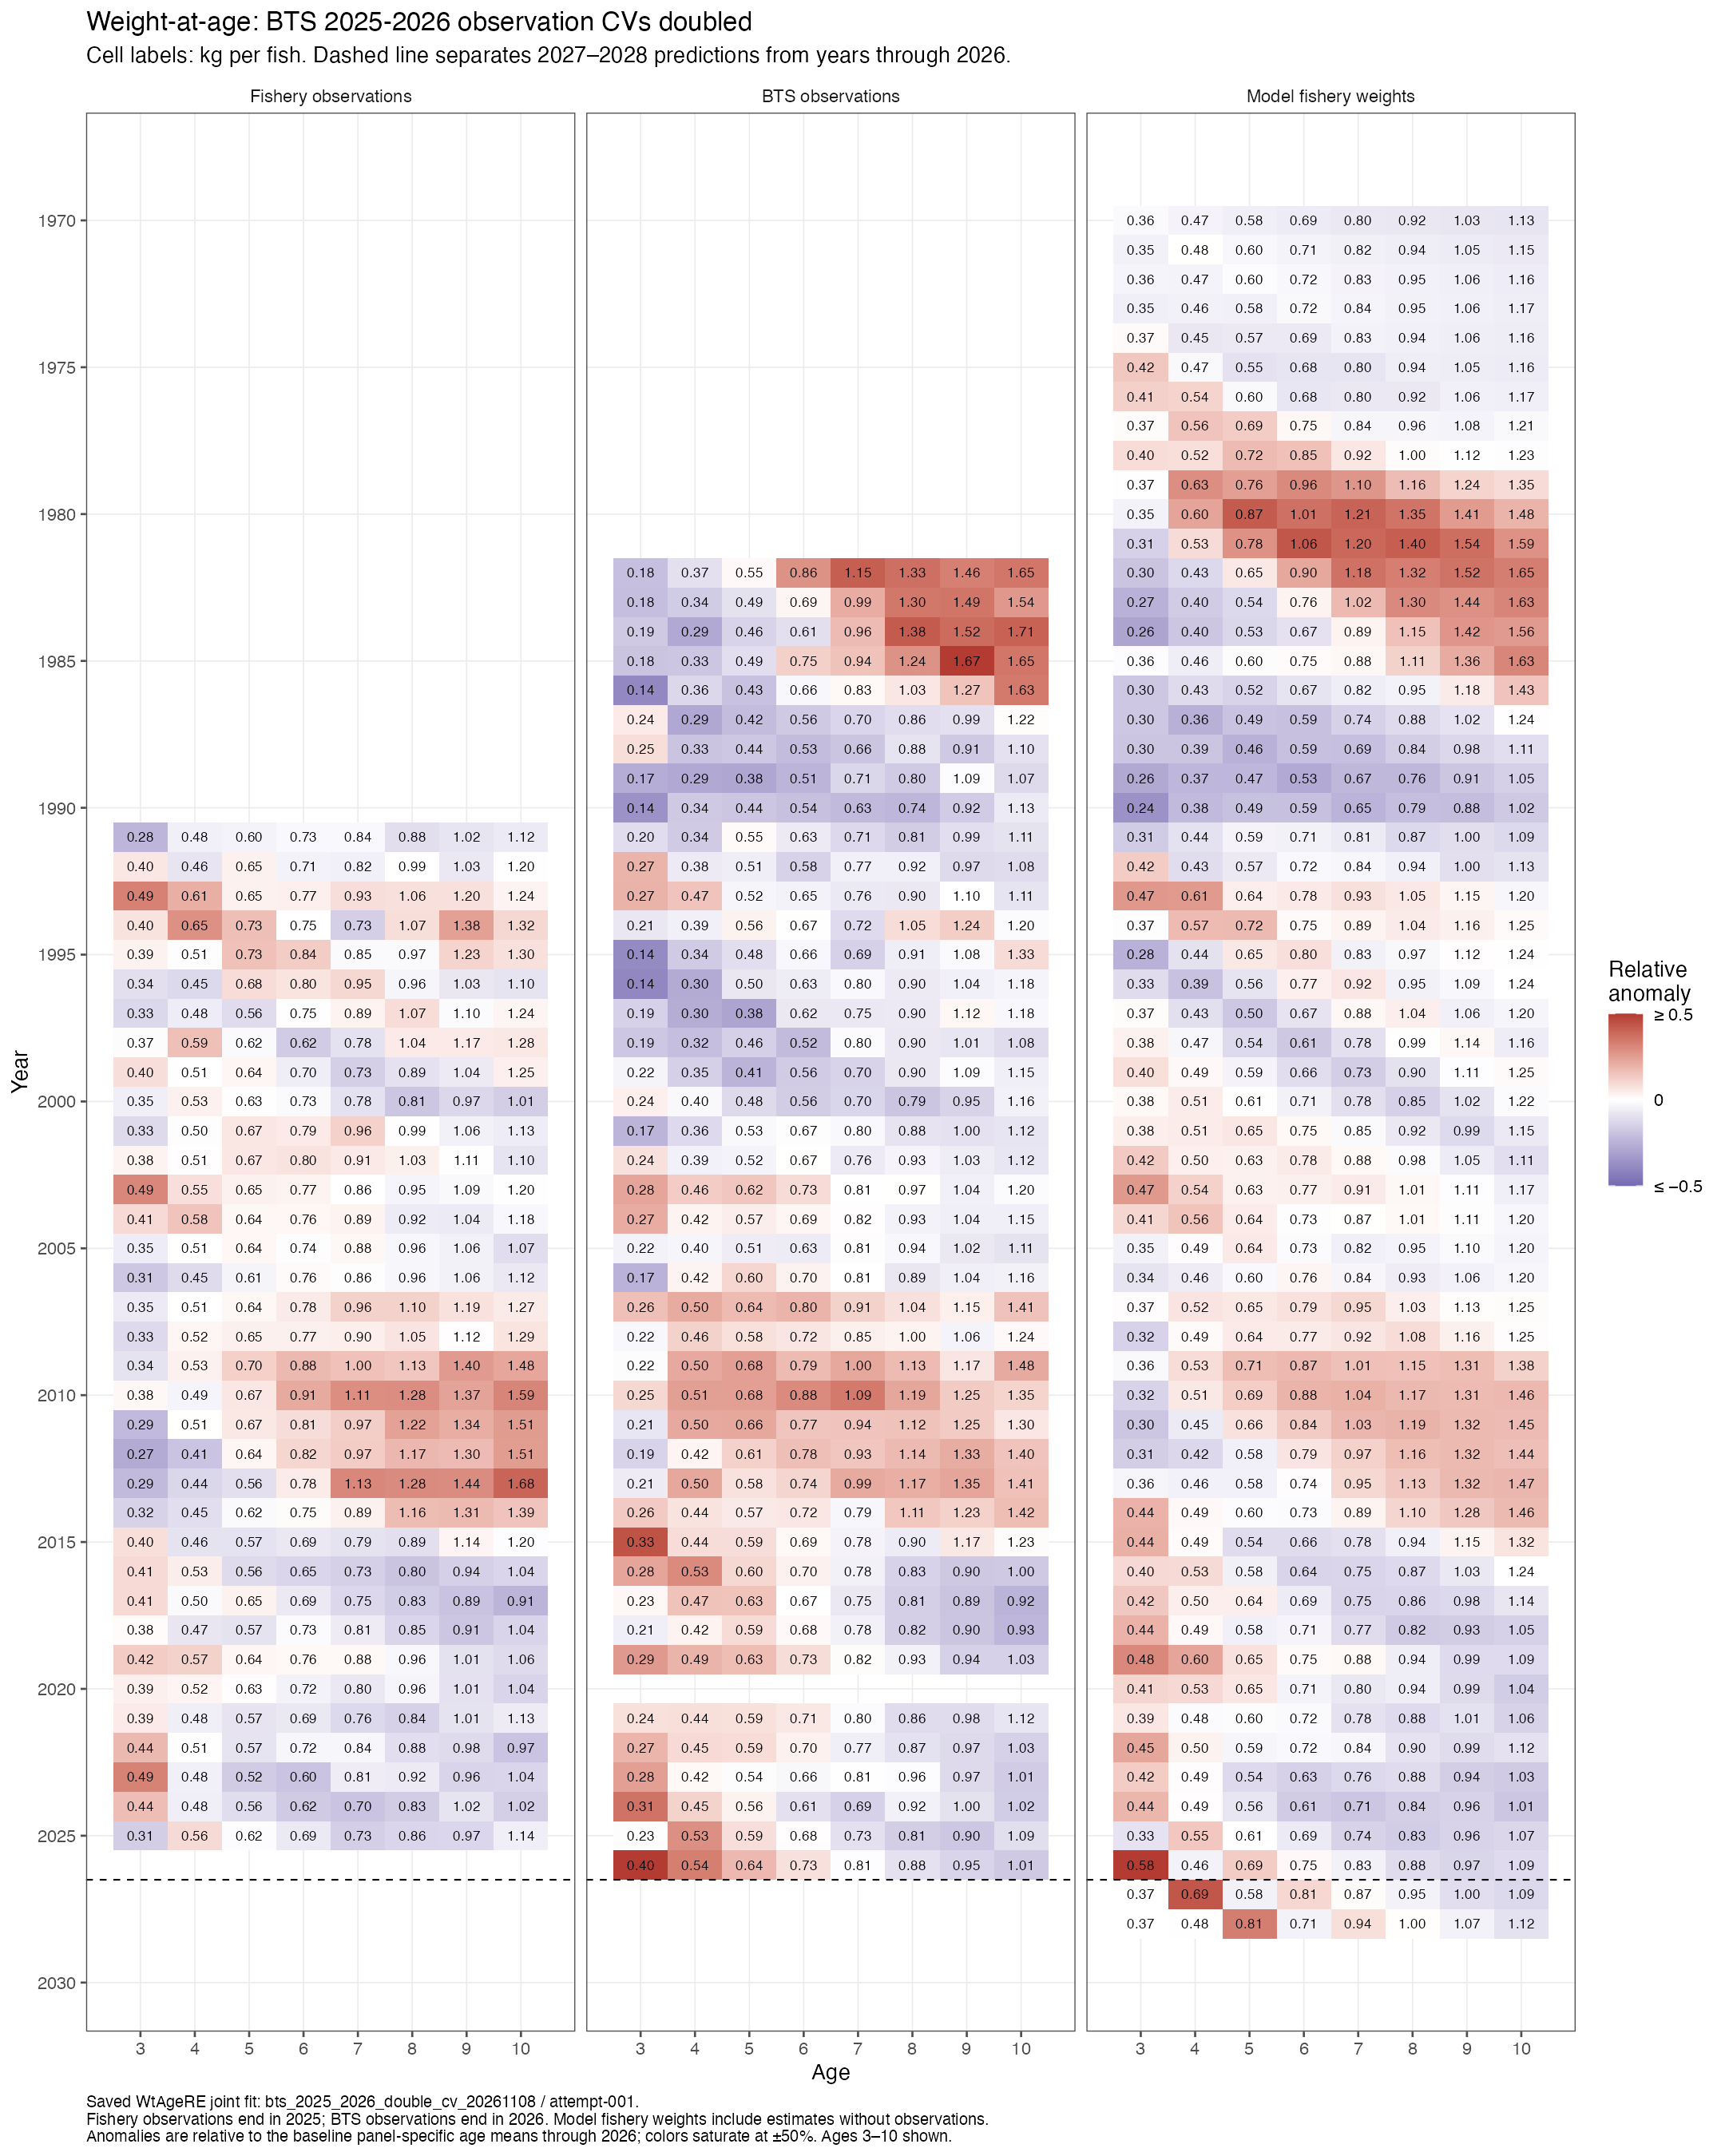
Run: bts_2025_2026_double_cv_20261108/attempt-001; baseline: ebs_fishery2026_pool9_12_cv100_20261022/attempt-001. Numerical convergence establishes an estimable sensitivity, while scientific adoption remains a separate assessment decision. Likelihood objectives use different assumed observation errors and therefore provide no direct test of improved fit. No assessment biomass, harvest advice, or assessment weights were replaced. Manual accessibility review is pending.