Attaching package: 'dplyr'The following objects are masked from 'package:stats':
filter, lagThe following objects are masked from 'package:base':
intersect, setdiff, setequal, unionAssessment homepage · Current assessment
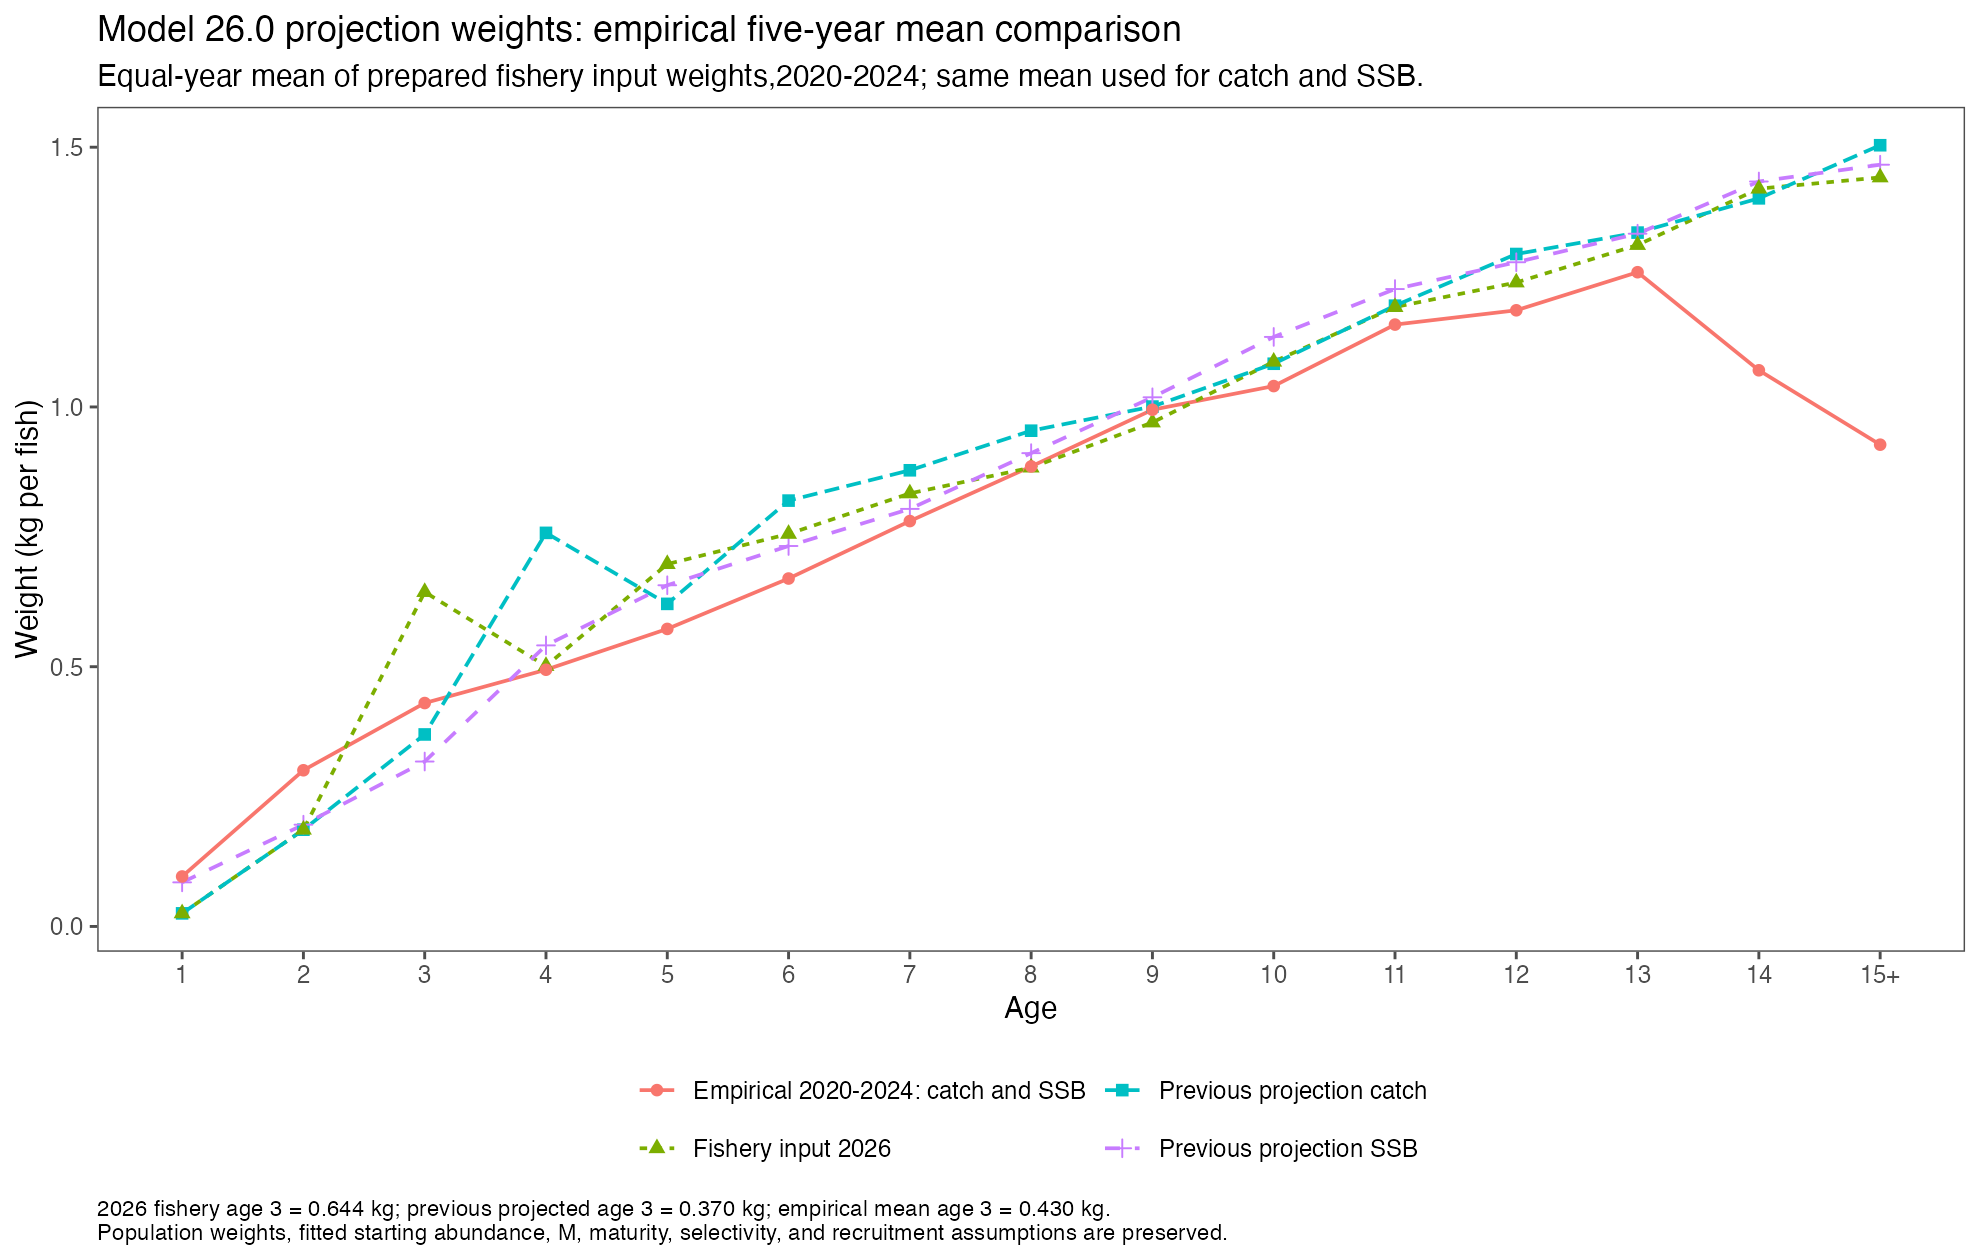
This comparison replaces both the projection fishery catch weights and spawning-biomass weights with the age-specific arithmetic mean of the prepared empirical fishery weight inputs for 2020–2024. Each year receives equal weight. The same 15-age vector is used for catch and SSB and is held fixed through 2027–2038. The original assessment and its projection products are preserved; these comparison results are separate from the assessment baseline.
Extended comparison with original and doubled-CV WtAgeRE forecasts adds the saved weight-model forecasts and a matched CV-effect control.
The empirical five-year age-3 mean is 0.430 kg. The weight supplied for the 2026 fishery is about 0.644 kg, while the original projection catch schedule already uses the 2027 forecast, about 0.370 kg at age 3. Thus the new comparison increases projected age-3 catch weight relative to the prior projection, even though it is below the high 2026 input. The full catch and SSB curves also change; effects cannot be assigned to age 3 alone. The age-4 catch-weight contrast is particularly large: 0.758 kg in the previous forecast versus 0.494 kg in the empirical mean.
The fitted 2026 abundance and mortality are retained when forming the initial 2027 population. This experiment therefore measures sensitivity to future projection weight assumptions, rather than removing the high 2026 weight from the assessment fit. The separate BTS-observation-CV sensitivity evaluates its influence within the standalone weight model. Neither comparison refits the stock assessment or replaces its advice.
Attaching package: 'dplyr'The following objects are masked from 'package:stats':
filter, lagThe following objects are masked from 'package:base':
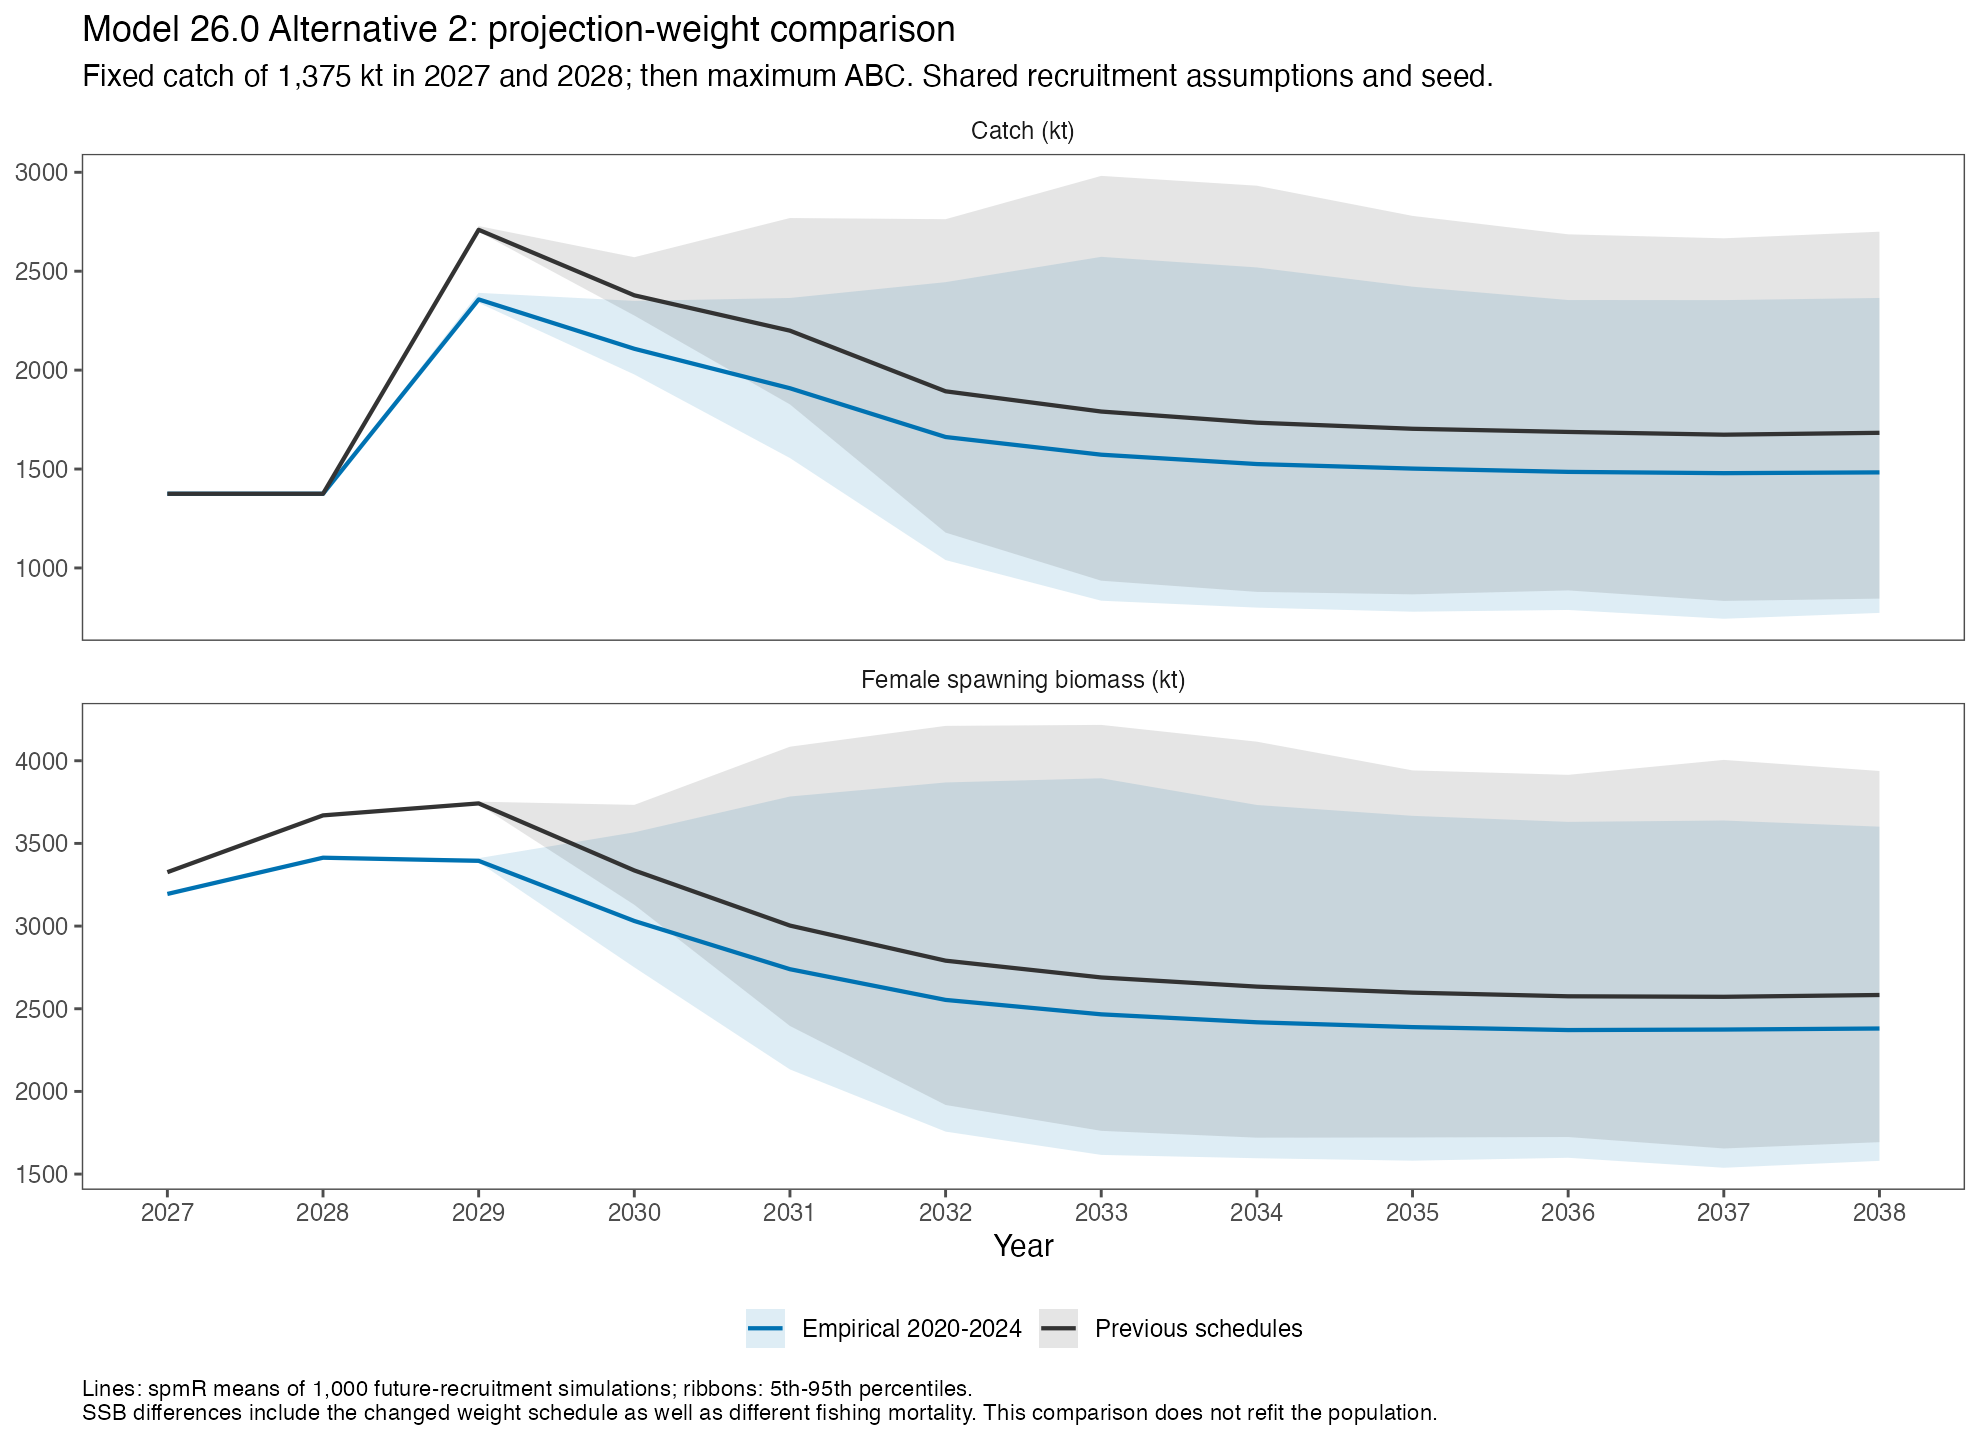
intersect, setdiff, setequal, unionUnder the primary selectivity assumption, maximum ABC decreases by 7.5% in 2027 and 7.3% in 2028. The expected catch remains 1,375 kt in both years. Higher fishing mortality is required to take that fixed tonnage under the empirical catch-weight schedule.
| Year | Previous max ABC (kt) | Empirical max ABC (kt) | ABC change (%) | Previous OFL (kt) | Empirical OFL (kt) |
|---|---|---|---|---|---|
| 2027 | 2,222.3 | 2,056.1 | −7.5 | 2,746.2 | 2,539.1 |
| 2028 | 2,318.8 | 2,149.2 | −7.3 | 2,869.8 | 2,661.7 |
| Native spmR means across 1,000 future-recruitment simulations; Alternative 2. These are comparison outputs, not adopted catch advice. | |||||
The SSB differences reflect the altered weight schedule as well as changes in fishing mortality and surviving age structure. They represent a changed projection calculation, rather than evidence for a change in the fitted population. SPR reference fishing rates and biomass reference points are recalculated consistently with the new SSB weights.
| Schedules | B35% (kt) | B40% (kt) | F40 | F35 |
|---|---|---|---|---|
| previous | 2,181.8 | 2,493.5 | 0.5338 | 0.6884 |
| empirical_2020_2024 | 2,012.9 | 2,300.5 | 0.5775 | 0.7480 |
The source is the prepared annual observation input, before WtAgeRE smoothing or prediction. Historical 2020–2023 inputs retain their existing age basis and previously authorized interpolation for sparse cells. The 2024 inputs use the year-specific FT-NIR-to-independent-TMA conversion, including the approved tail preparation. Hence “empirical” here distinguishes the prepared annual data curves from fitted/predicted weight curves; it does not imply that every sparse historical cell had an independent observation. All five age-3 annual values are available without the historical mean fills.
| Age (15 = 15+) | Catch and SSB weight (kg) | Annual input values |
|---|---|---|
| 1 | 0.0962 | 5 |
| 2 | 0.3006 | 5 |
| 3 | 0.4300 | 5 |
| 4 | 0.4942 | 5 |
| 5 | 0.5727 | 5 |
| 6 | 0.6697 | 5 |
| 7 | 0.7803 | 5 |
| 8 | 0.8855 | 5 |
| 9 | 0.9946 | 5 |
| 10 | 1.0402 | 5 |
| 11 | 1.1586 | 5 |
| 12 | 1.1861 | 5 |
| 13 | 1.2594 | 5 |
| 14 | 1.0706 | 5 |
| 15 | 0.9274 | 5 |
All 75 annual inputs · Inherited historical gap-filling record
The population-biomass weights stay at their previous 2026 values. Maturity, natural mortality, sex ratio, spawning timing, fitted initial population, recruitment history, fixed catches, and selectivity are held constant. The primary selectivity average is 2023–2025; the 2024–2026 window check is also repeated. Both cases use the 1978–2023 age-1 recruitment history, the same random seed (123), and identical recruitment draws for each simulation, year, and scenario. All seven harvest scenarios are run through 2038.
The matched runs use the same frozen spmR 0.4.1 package and ADMB projection runtime. All 12 native executions exit 0 and pass fresh-output checks. The only numerical species-input vectors that differ between matched cases are catch and spawning weights; population-weight metadata are identical. These historical-recruitment projections estimate no parameters, so optimizer gradients and Hessian checks are inapplicable. The fitted assessment is read without refitting.
An independent Python replay checks all 168 deterministic scenario-year rows across both selectivity windows, including SPR roots, catch solutions, the B20 closure, and plus-group accounting. Its maximum relative error is below 5 × 10⁻¹³. Native first-year projections also agree with the independent calculation within output precision. Projection intervals represent future recruitment variation, conditional on fixed inputs; assessment and weight uncertainty are outside these intervals.
Manual accessibility review remains pending.