These are comparison runs, retaining the published assessment and its projections. The new case uses fishery weights from the saved WtAgeRE run in which BTS observation CVs were doubled for 2025–2026. No weight-model or stock- assessment refit is performed here. All projections use the same fitted starting population, mortality, maturity, selectivity, recruitment history, and matched future recruitment draws.
What is compared
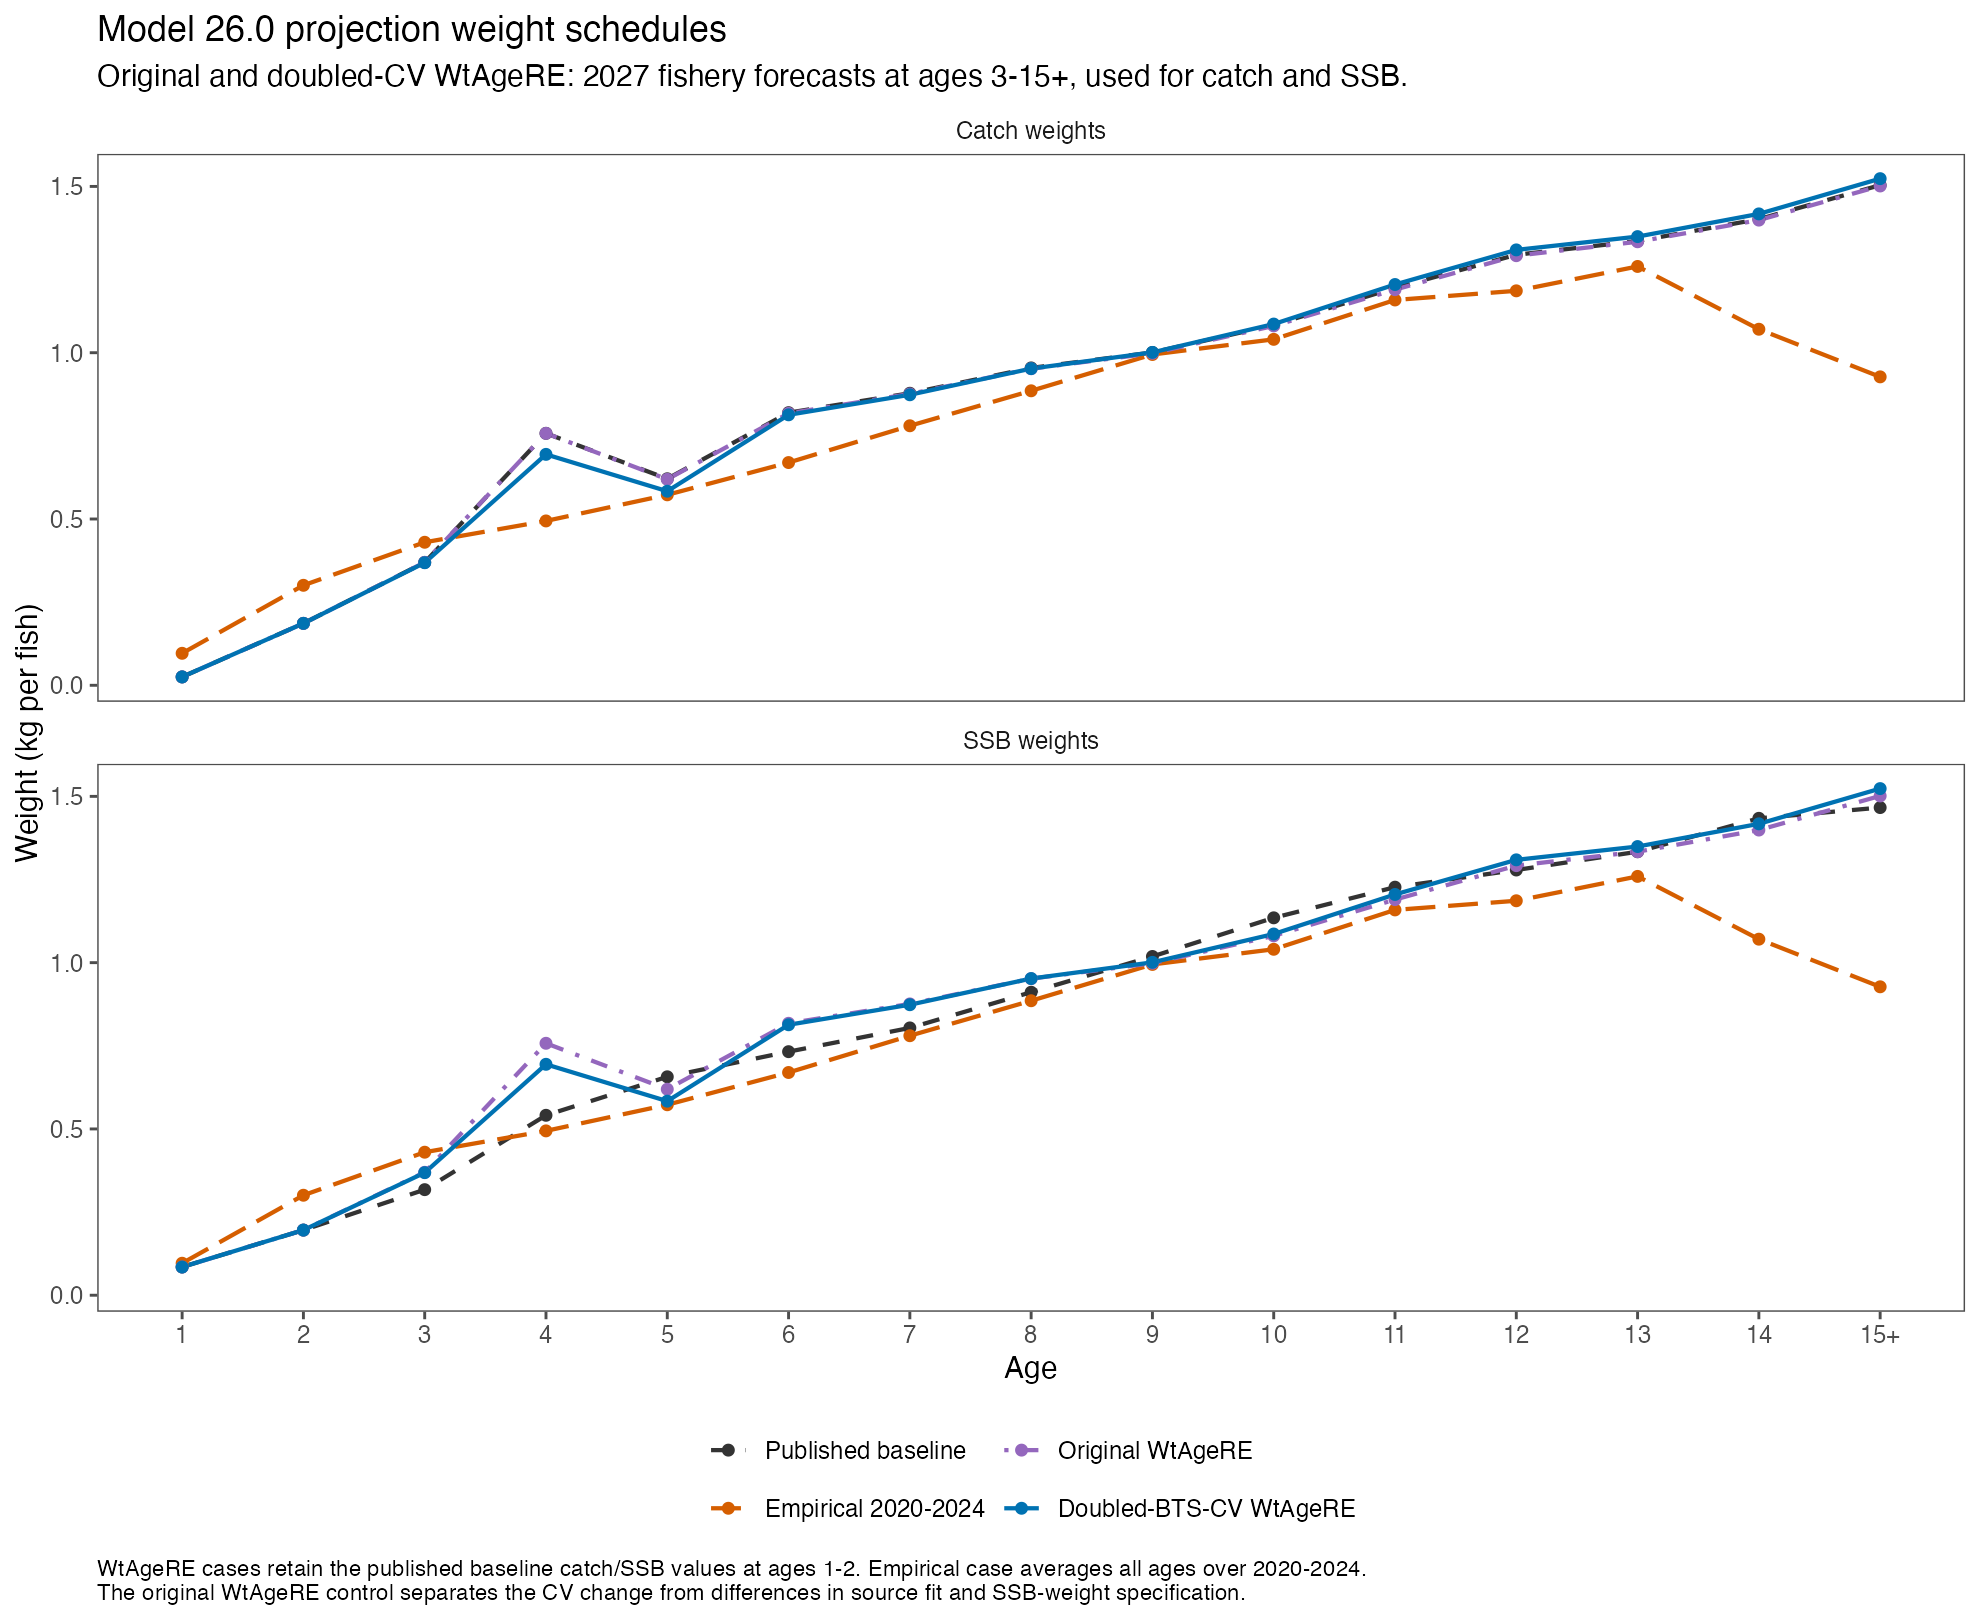
Published baseline: the prior projection catch-weight forecast and carried 2026 spawning weights.
Empirical 2020–2024: the equal-year arithmetic mean of the prepared annual fishery inputs, used for both catch and SSB at all ages.
Original WtAgeRE control: 2027 fishery forecasts from the original saved WtAgeRE fit, used for both catch and SSB at ages 3–15+.
Doubled-BTS-CV WtAgeRE: 2027 fishery forecasts from the doubled-CV fit, used under exactly the same rules as the original-WtAgeRE control.
WtAgeRE estimates ages 3–15+. Both WtAgeRE projection cases retain their respective published-baseline catch and spawning weights for ages 1–2. The selected 2027 forecast vector is fixed throughout 2027–2038; it is not replaced by the separate 2028 forecast in later years. Population- biomass weights are unchanged. The fishery forecast is explicitly used as an SSB-weight proxy in both WtAgeRE cases, matching the common-curve idea in the empirical comparison at modeled ages.
The original-WtAgeRE control is essential for interpreting the CV change: the published baseline has a different source fit and SSB specification. The original-versus-doubled WtAgeRE contrast isolates the CV sensitivity; comparisons with the published baseline or empirical means combine additional weight-schedule differences.
Catch and SSB weight-at-age panels compare the published baseline, empirical five-year means, original WtAgeRE forecasts, and doubled-CV forecasts.
Short-term results
Attaching package: 'dplyr'
The following objects are masked from 'package:stats':
filter, lag
The following objects are masked from 'package:base':
intersect, setdiff, setequal, union
Case
2027 max ABC (kt)
2028 max ABC (kt)
Published baseline
2,222.3
2,318.8
Empirical 2020–2024
2,056.1
2,149.2
Original WtAgeRE
2,469.1
2,577.0
Doubled-BTS-CV WtAgeRE
2,296.8
2,375.7
Native spmR means over 1,000 simulations, Alternative 2; expected catch remains 1,375 kt in 2027 and 2028.
The doubled-CV case gives maximum ABC of about 2,297 kt in 2027 and 2,376 kt in 2028. Relative to the published projection baseline, these are increases of 3.3% and 2.5%. Relative to the empirical-mean case, they are increases of 11.7% and 10.5%.
Under the matched WtAgeRE specification, doubling the recent BTS CVs reduces maximum ABC by 7.0% in 2027 and 7.8% in 2028. This last contrast is the direct CV-effect comparison. The CV change affects the full fitted and forecast age profile, so the projection effect represents more than a change to projected age-3 weight alone.
Case
Year
Female SSB (kt)
OFL (kt)
F for prescribed catch
Published baseline
2027
3,326.0
2,746.2
0.3096
Published baseline
2028
3,669.5
2,869.8
0.2963
Empirical 2020–2024
2027
3,194.3
2,539.1
0.3627
Empirical 2020–2024
2028
3,413.5
2,661.7
0.3469
Original WtAgeRE
2027
3,867.1
3,066.9
0.3102
Original WtAgeRE
2028
4,023.0
3,206.5
0.2970
Doubled-BTS-CV WtAgeRE
2027
3,707.0
2,846.7
0.3197
Doubled-BTS-CV WtAgeRE
2028
3,840.7
2,950.1
0.3091
SSB values use different weight schedules and therefore reflect both the weight basis and subsequent fishing mortality/age structure. These are conditional projections of the same fitted starting population, not new assessment estimates of the stock.
Age-3 context and full weight curves
The 2026 WtAgeRE weight peak was the motivation for these comparisons. The standard projection convention uses the 2027 forecast, rather than carrying the large 2026 age-3 value forward at age 3. Effects also appear at older forecast ages, making the full age profile relevant.
Age
Published baseline
Empirical 2020–2024
Original WtAgeRE
Doubled-BTS-CV WtAgeRE
3
0.370
0.430
0.370
0.369
4
0.758
0.494
0.758
0.694
5
0.621
0.573
0.619
0.584
6
0.820
0.670
0.818
0.813
7
0.878
0.780
0.876
0.874
Projected catch weight in kg. The empirical inputs retain their documented historical sparse-cell preparation.
Projection trajectories and reference points
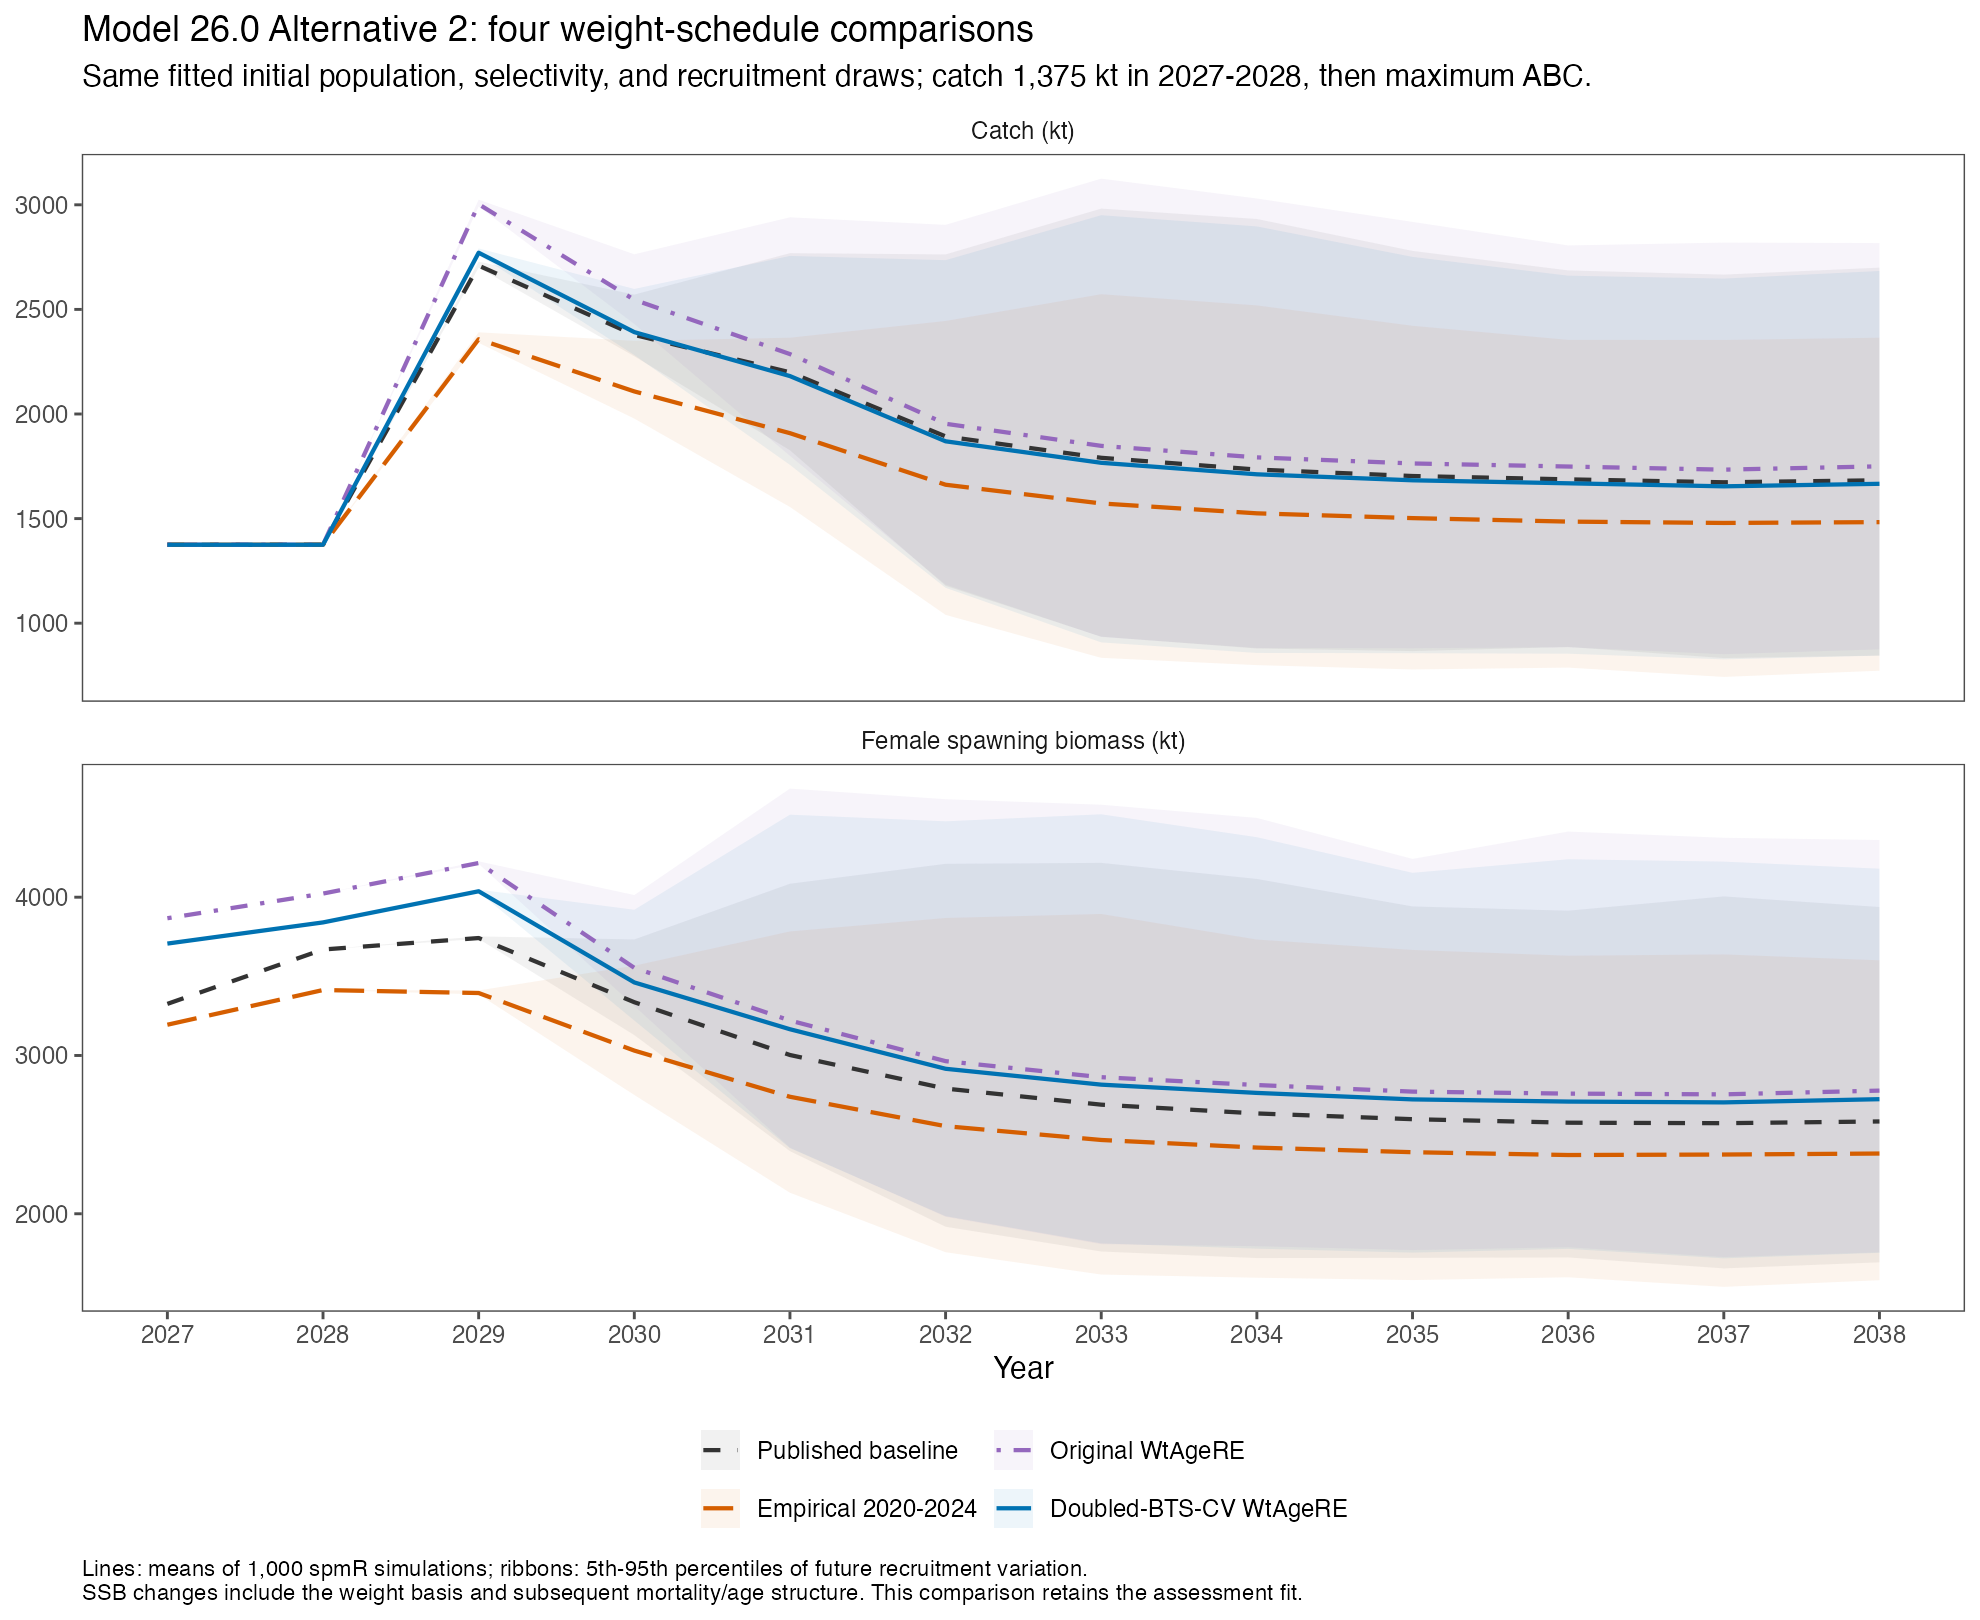
Alternative-2 catch and SSB trajectories compare all four weight schedules with the same recruitment draws. Ribbons show future recruitment variation only.
Case
B35% (kt)
B40% (kt)
F40
F35
Published baseline
2,181.8
2,493.5
0.5338
0.6884
Empirical 2020–2024
2,012.9
2,300.5
0.5775
0.7480
Original WtAgeRE
2,337.3
2,671.2
0.6061
0.7918
Doubled-BTS-CV WtAgeRE
2,294.4
2,622.2
0.5751
0.7478
Reference points are recalculated for each SSB-weight schedule. All seven harvest scenarios are compared through 2038, with both the 2023–2025 primary selectivity average and the 2024–2026 window check. The 1,375-kt catches apply only to Alternative 2 in 2027–2028. Intervals represent future recruitment variation; assessment and weight-estimation uncertainty are outside them.
Verification and downloads
The new runs use the same frozen spmR 0.4.1 package and ADMB runtime as the previous comparison, with 1,000 simulations and seed 123. For every matched case, the only numerical species-input vectors changed are catch and spawning weights. Population-weight metadata are identical. Recruitment draws match exactly by scenario, simulation, and year across all four cases. All new native executions exited 0 and passed fresh-output checks.
An independent replay verifies all 168 deterministic scenario-year rows for each of the two new cases (336 rows total), including SPR roots, the fixed- catch solutions, the B20 rule, and the plus group. Maximum relative errors are below 9 × 10⁻¹⁴. Fresh first-year native results agree with the independent calculations within output precision. These historical-recruitment projections estimate no parameters, so optimizer gradients and Hessians are inapplicable here; the saved weight-model fits retain their separate convergence records.